
Most construction and capital projects still rely on manual data tracking to understand task completion and project progress. Effective project production management depends on more than collecting data; it requires production information that is validated, reliable, and available soon enough to influence project execution. This paper presents a low-cost, passive IoT-based sensing approach that converts machine activity into validated task-level production data without manual data collection or changes to existing work processes. AI/ML classification transforms sensor signals into production events, enabling automated calculation of key production metrics including cycle time, throughput, capacity, and variability. In a one-week fabrication case study, the system was deployed in under 30 minutes, visualized production results within 15 minutes, and predicted 166 completed welds against 164 actual welds, demonstrating approximately 99% completed-quantity accuracy. Because the approach relies on machine activity patterns rather than welding-specific inputs, the underlying hardware and software framework is task-agnostic and can be extended to a broad range of machine-supported construction and industrial activities, providing a scalable foundation for faster, more reliable production control.
Keywords: Production Measurement; Production Modeling; IoT; AI; ML

Dan Rahill spent 16 years at Chevron at the intersection of capital projects and technology. Key roles included Global Project Performance Advisor; Data & AI/ML Manager, and Digital Twin Manager. Recently, Dan founded Pirimid to answer the question of what is happening on capital projects and why in real-time. He has an MS in Systems Engineering ...
Most construction and capital projects still rely on manual data tracking to understand task completion and project progress. These systems are often slow, subjective, labor-intensive, and too coarse to support meaningful production control. Work-in-process (WIP) is likely to be calculated rather than directly observed and subject to reporting errors. Daily reports may be submitted at the end of each shift, but consolidating them, resolving inconsistencies, checking information submitted by multiple teams, and converting the results into usable data for decision-making can take days, and in some organizations up to a week. As one project leader put it, “ice cream, fish, and progress reports all have the same shelf life in the sun”: they lose value quickly. By the time the report explains what happened, it may already be too late for a foreman, superintendent, or project team to make adjustments while the issue is still unfolding. The deeper issue is not simply a lack of data; it is the delay between work being performed in the field, progress being validated, and teams being able to respond, adjust, and optimize the plan at a tactical level.
Many manufacturing and fabrication operations manage production through ERP platforms, quality systems, scheduling tools, and production dashboards, while more specialized environments may also use Manufacturing Execution Systems (MES) and Overall Equipment Effectiveness (OEE) frameworks. These systems reflect a broader recognition that production performance depends on timely information about availability, performance, quality, throughput, and resource utilization. While productivity comparisons across industries are imperfect, a 2024 paper from the National Bureau of Economic Research reports that manufacturing productivity has improved by 86% since 1990, while construction productivity has declined by 21% over the same period. The name of the system matters less than whether it gives teams trusted information quickly enough to act.1
Even mature production environments can still experience delays between machine activity, validated production quantities, and corrective action. In recent workflow reviews with several energy-sector manufacturing firms, project managers reported making additional shop visits to confirm status before reporting progress to management and clients, not because the software lacked data, but because the available data was not trusted quickly enough to support confident reporting. Capital projects face the same problem in a more temporary, significantly more variable, and less instrumented environment. Work fronts move, crews change, designs are often unique, and production activities may be intermittent rather than continuous. As a result, capital projects often lack an equivalent production control system even though they rely on the same basic ingredients as manufacturing: equipment, labor, materials, constraints, work sequencing, and flow.
Recent technologies such as computer vision, spherical cameras, drones, robotic surveying devices, and Building Information Model (BIM) based progress comparison have improved the ability to document installed work and identify certain construction errors. These tools provide value, especially for visual verification and periodic progress assessment, but they often do not solve the specific problem of real-time production control. Many image-based systems capture progress at periodic intervals, commonly weekly, which can show what changed between scans but not why production advanced or stalled within the interval. As a result, they suffer from insufficient temporal resolution to support root cause analysis and may be too slow or too coarse to identify task-level bottlenecks, idle time, rework, or inefficient work patterns while those issues can still be proactively addressed. Wearable-based systems provide another view of activity, but they can raise privacy concerns and may be vulnerable to inaccurate activity signals or gaming, similar to how automated input devices, such as mouse jigglers or keyboard tappers, can simulate computer activity without producing useful work. The familiar management maxim “what gets measured gets managed” is useful, but incomplete: what gets measured poorly can also be misunderstood, mistrusted, or gamed. For machine-supported work, the more useful signal is often actual machine telematics: when the equipment is producing, how long the task takes, what throughput is achieved, quality indication, and how that activity connects to completed work.
To address this challenge, this paper evaluates a passive sensing approach that measures machine-supported work directly rather than relying on manual reports, periodic scans, or worker movement as proxies for production. The approach adapts measurement for a production system to capital project environments where work fronts change, operations may be intermittent, designs are often unique, and long implementation cycles are impractical. By using non-invasive, affordable hardware that can be deployed in as little as 30 minutes, the system converts machine activity into task-level production data that can support near-real-time calculation of cycle time, throughput, capacity, and variability. Long-term the goal is to enable real-time production control down to individual quantities in real-time.
A case study was completed at an oil and gas filtration fabrication facility in Texas over a one-week period. The facility had a large order for filtration equipment that required a significant number of 3-inch pipe fillet welds, making it a useful, repeated task for evaluating production measurement. The client wanted to validate the throughput and effort required for future pricing, order scheduling, capacity planning, labor allocation, and onboarding timelines. The evaluation focused on the welding preparation and execution outlined below.
As shown in Figure 1, upstream material delivery, component movement, fit-up, and tack welding were completed in batch before the final welding operation. These tacked components were then moved into staging inventory, where they formed the work queue for the welding step. The final preparation and welding were completed in unit flow by a single person: the welder moved each tacked component into position, completed the MIG weld, and moved the finished unit to a designated completed-product area. During the evaluation, inventory availability did not constrain the process, allowing the study to focus on whether final welding output could be measured accurately from machine activity.
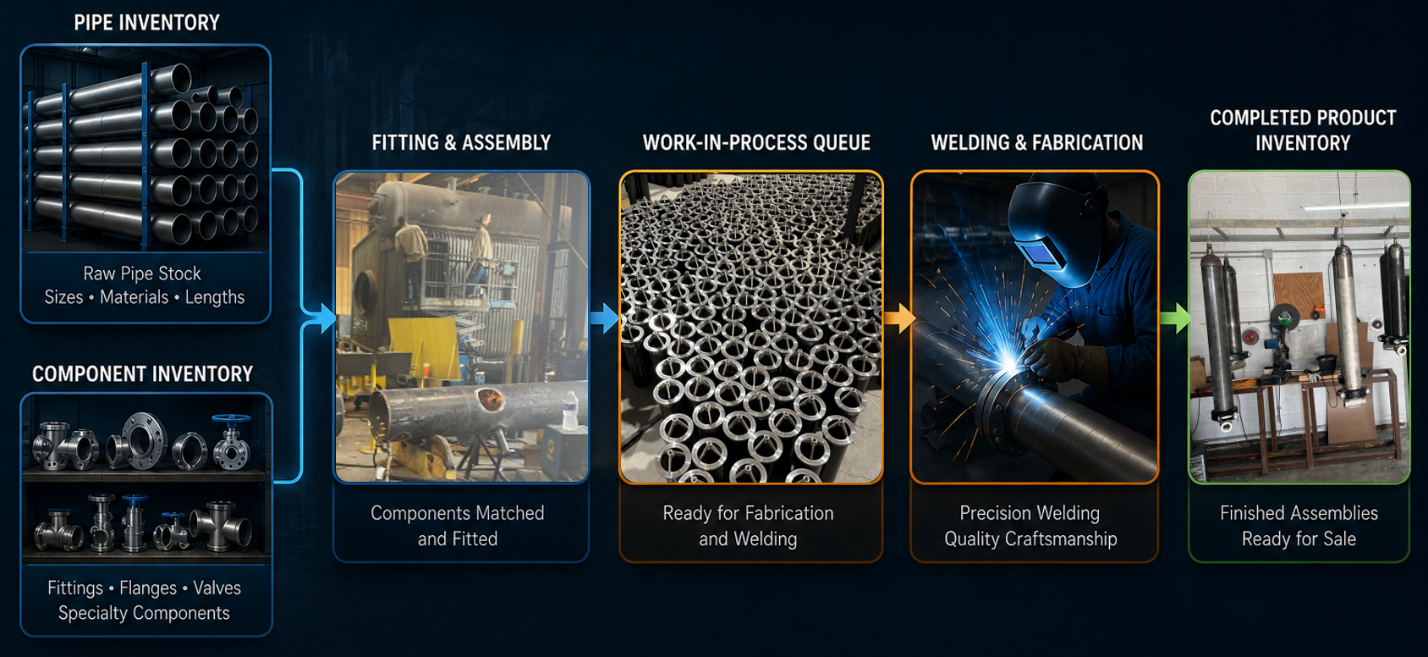
This process was selected due to the simplicity to validate the core functionality: can welding output be measured in real-time to provide an accurate input for a production system?
Design documents such as mechanical drawings and welding specifications were used to calculate key physical parameters including expected welding duration, welding volume, and welder settings. These were used both to assist with initial calibration as well as detect outliers which could be indicative of rework or deviation from execution plan among other things. Notably, the key parameter for costing is unit cycle time of the welding process. Cycle time is defined as the duration from the end of the previous weld to the end of the current weld. It is both a significant cost in terms of labor as well as the largest source of variability in the fabrication process.
Daily plan information was also used to confirm the weld type assigned to the monitored machine for the duration of the one-week evaluation. This simplified the initial validation by reducing the number of overlapping work types that had to be classified from the same machine signal. More complex mixed-work environments would require additional classification logic, but the controlled setup provided a clear first test of whether machine activity could be converted into accurate completed-quantity measurement.
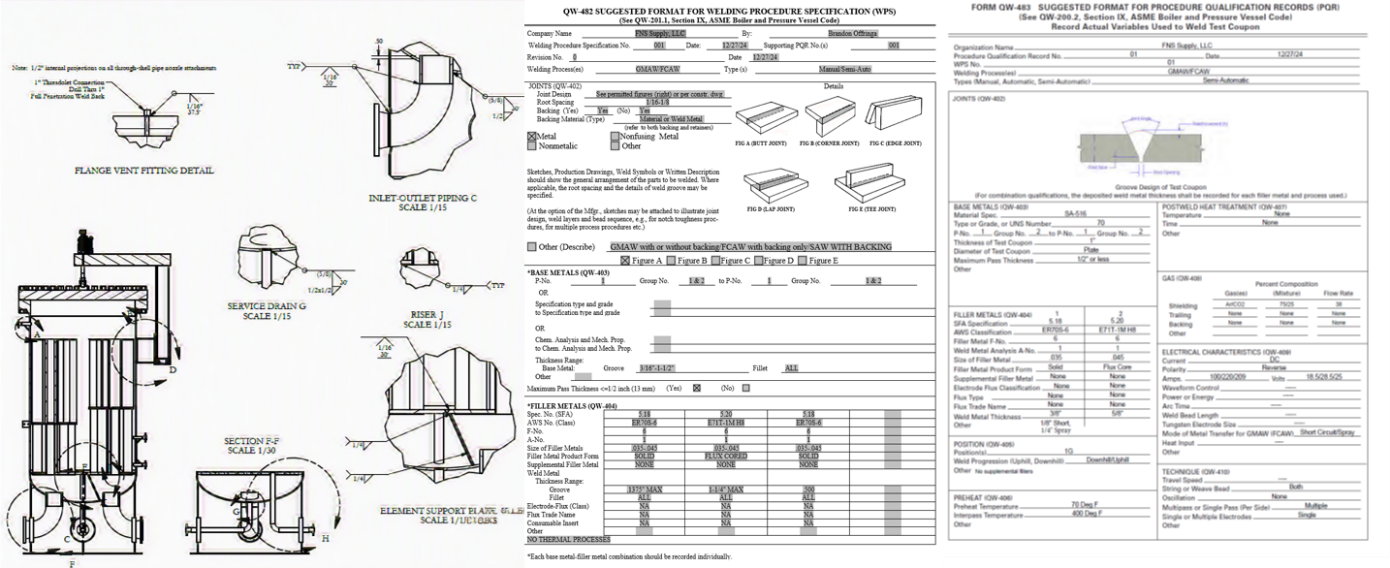
Long-range wireless power sensors were used to infer the welding timeline and volume in real-time. One sensor is required for each welding machine. This paper focuses on one of many machines evaluated. Data from the sensors was streamed to the cloud where it was stored, processed, classified with machine learning, and then visualized in a web application within 15 minutes. Daily units completed were evaluated at the end of the day through manual effort. Additionally, operations were also validated on-site visually to ensure accuracy of the results.
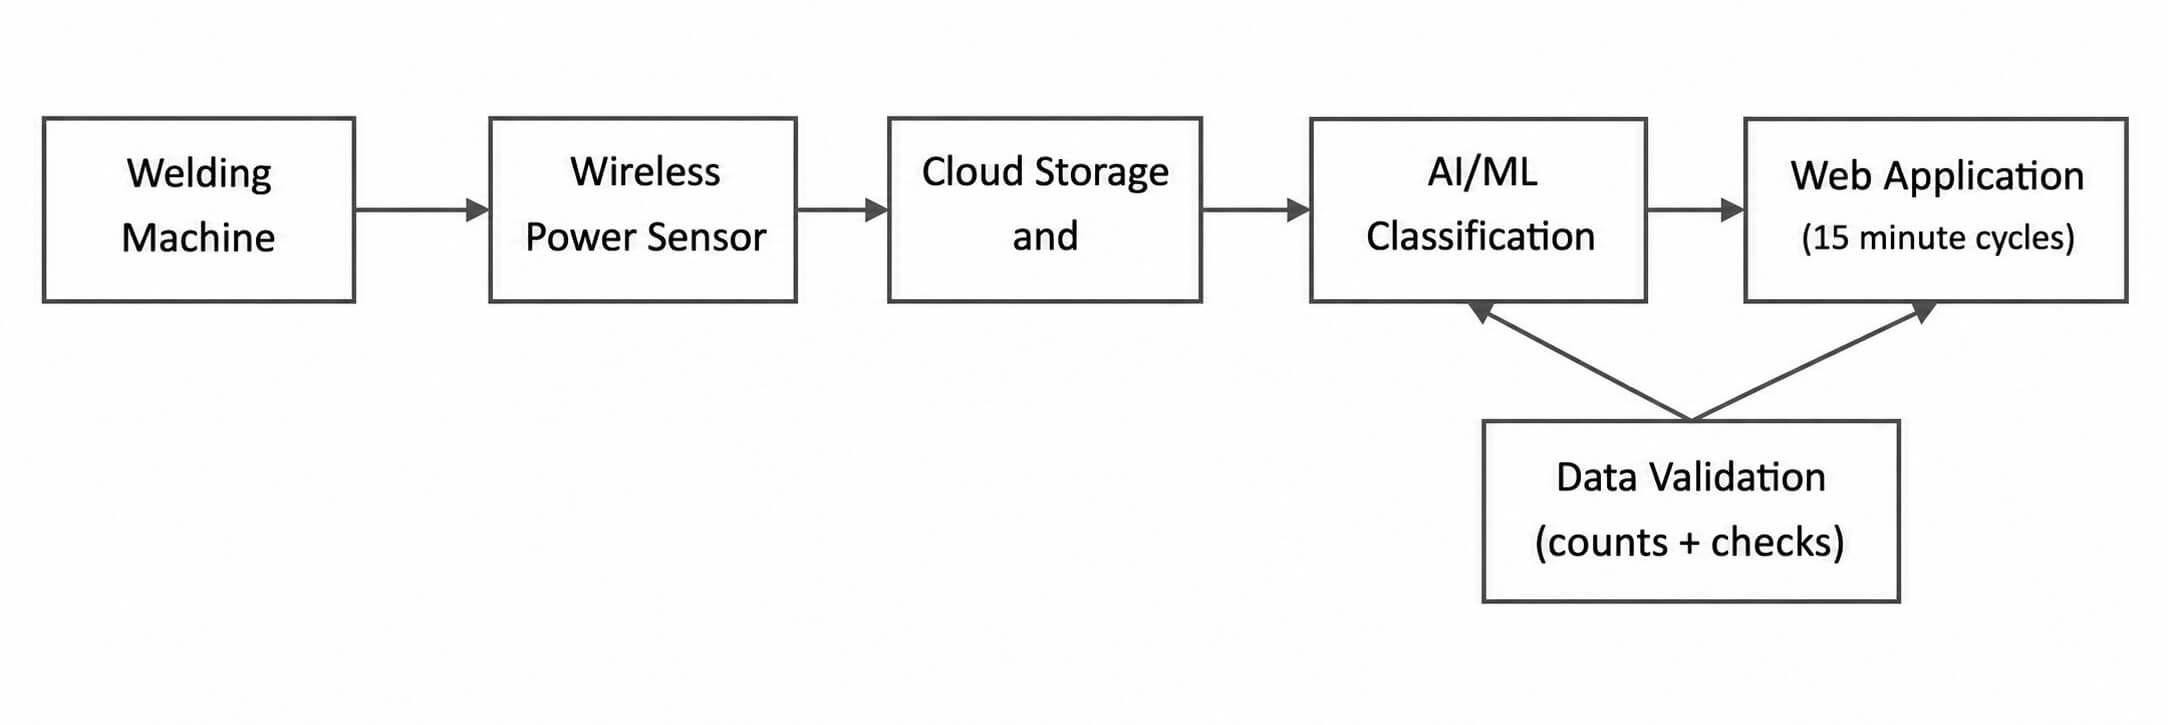
Before the one-week evaluation began, approximately 25 early welds were manually labeled and used to train the AI/ML classification model. The labeled samples provided supervised training data, effectively teaching the model how to classify welding activity from the power signal. This calibration period also allowed the team to observe the production process end-to-end, confirm that the sensors were operating correctly, and verify that the measured signal aligned with the expected weld pattern developed from the design documents and welding specifications.
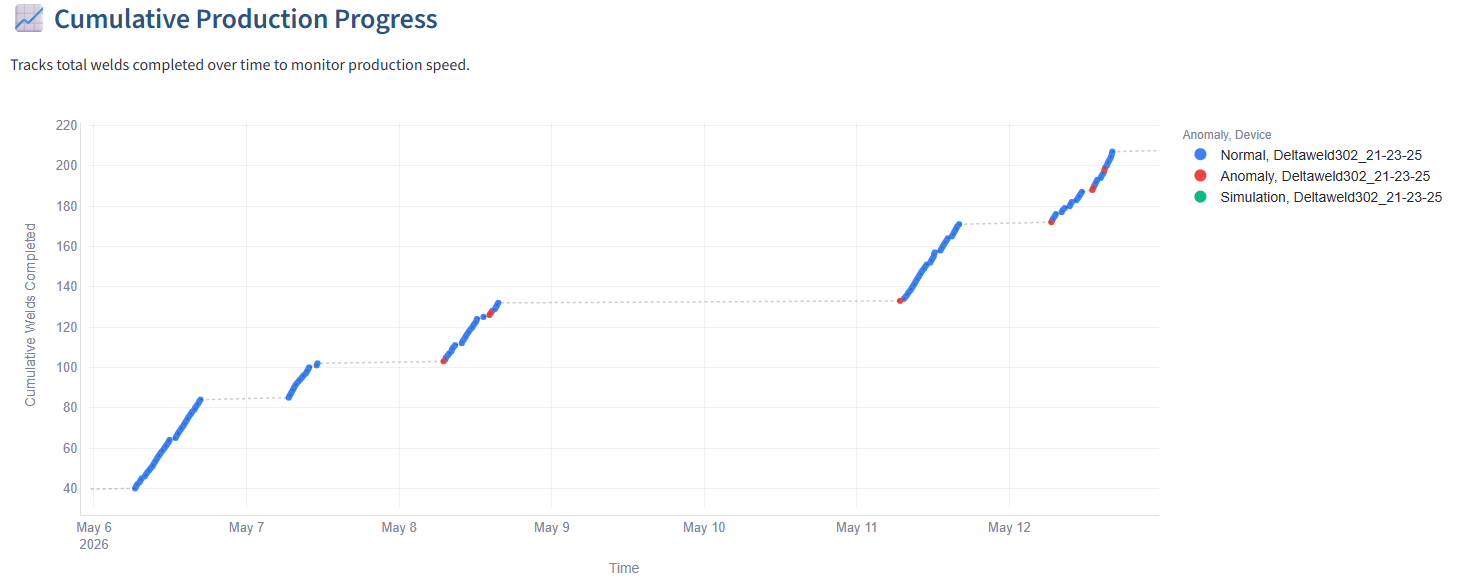
The first question was whether the system could count completed welds accurately enough to support production control. Over the one-week evaluation, 164 welds were completed and 166 welds were predicted by the system, demonstrating approximately 99% completed-quantity accuracy. At the signal-classification level, 99.8% of data points were correctly classified as active arc or non-active arc. The remaining errors were associated with edge cases, or unusual operating conditions, such as rework, minor touch-ups, errant arcs, unusually short cycle times, or low deposit amounts. Two of the three misclassifications were identifiable as anomalies, reinforcing the importance of combining machine-signal classification with expected production patterns rather than simply counting electrical on/off events.
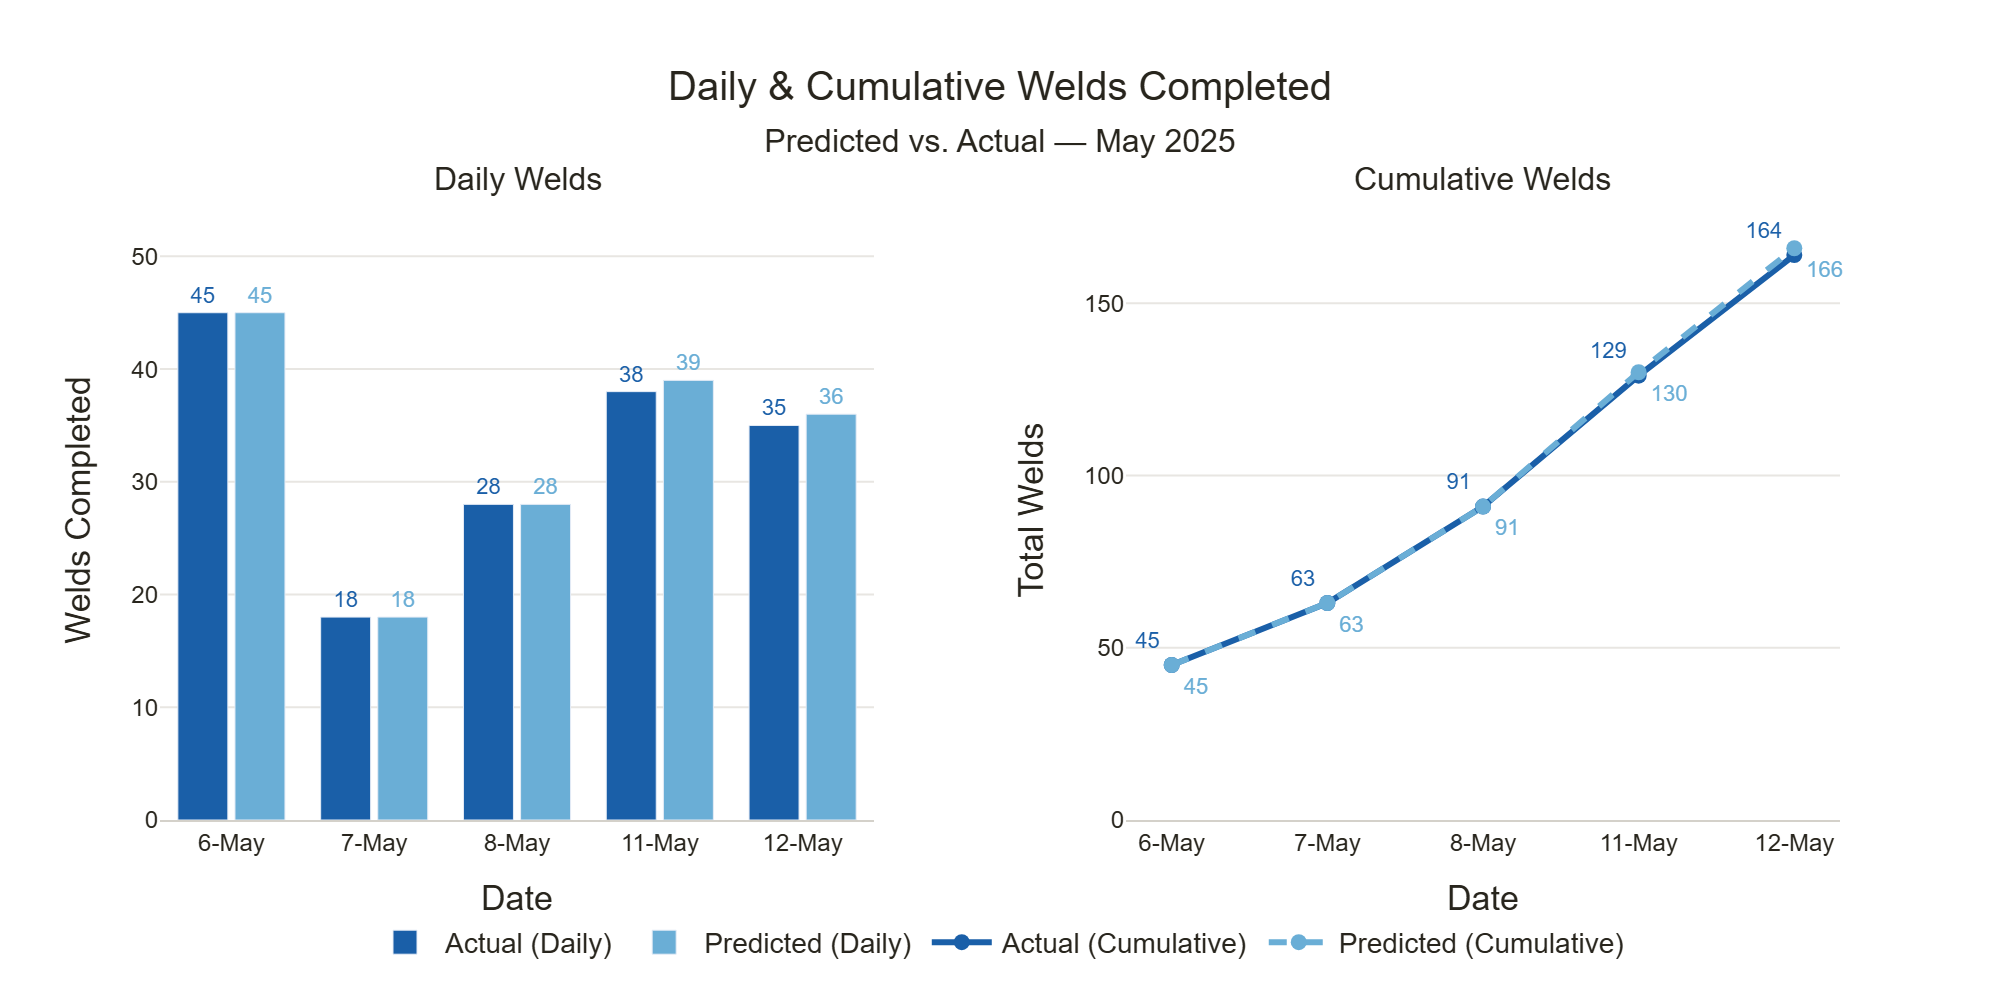
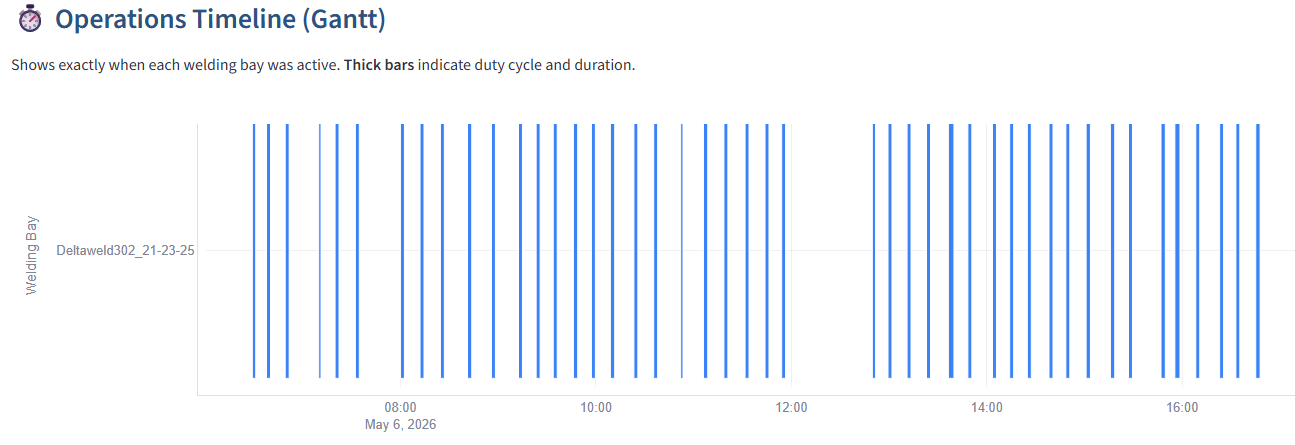
The time-based data also showed why completed counts changed from day to day. Figure 5 shows a full-capacity production day, where the timing of each weld, setup interval, and lunch break can be seen directly. The following day demonstrated a different source of variance: the issue was not welding rate, but reduced task allocation because the day was split with another activity. Although the throughput rate during active welding was similar, the number of hours spent on the task differed significantly across the week. In this case, the daily average time per weld varied by less than 1% standard error, while hours worked varied by 27% standard error. This distinction is critical for production control because it separates a production-rate problem from a resource-allocation, waiting, or scheduling problem.
Design data also helped calibrate the machine signal and connect measured activity to production quantities that matter for estimating, scheduling, and planning. Using the mechanical drawings, welding specifications, and observed power data, the system could compare expected weld duration and weld volume against actual machine behavior. This was important because the monitored operation used an older welding machine with lower efficiency than current equipment. After calibration, the measured weld-level results were consistent with the design expectations, allowing the system to estimate weld duration from weld size or, conversely, infer completed weld size from the sensor data. This capability is important for broader application because it supports differentiation between different weld types, such as a 2-inch pipe weld versus a 36-inch weld overlay on a forging, and can help consolidate multiple weld passes into a single production event.
| Weld Duration (min) | Cycle time (min) | Power (KW) | Weld Volume (in^3) | |
|---|---|---|---|---|
| Design | 1.50 | 10.0 | N/A | 0.38 |
| Actual | 1.43 | 12.0 | 9.5 | 0.40 |
Table 1: This table shows the alignment between the design data and the production data for one of the critical welds.
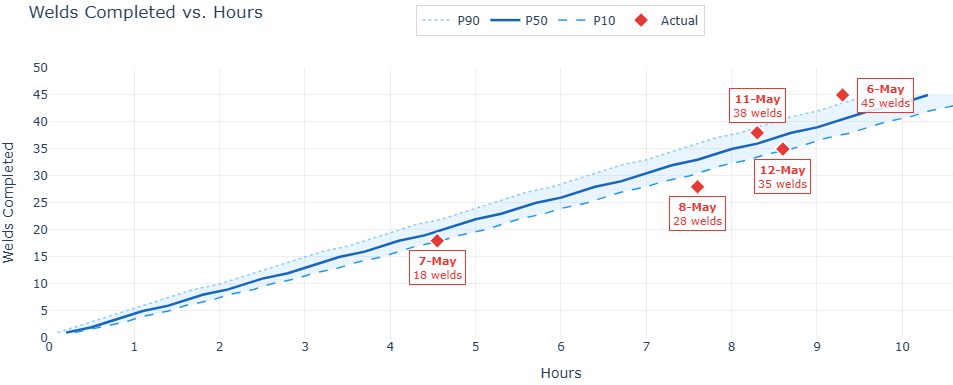
To validate that these results are reasonable and can be used for estimating, we applied them to the daily results. Assuming 9 hour workdays with an adjustment for 1.5 hours of lunch plus breaks, the results are within 1% of the weekly throughput. This very simple heuristic can quickly translate hours into progress, and the system can validate the results in real-time to calculate and decompose the deviations. Most importantly, you can quickly see where the differences are and make adjustments. In this case, the daily capacity estimates were optimistic by about 20%, but longer than average hours worked compensated for the difference.
We learned more from the first 5 hours of weld-level data than a team would typically learn from a week of daily progress totals. Over the week, the average daily output was 33 completed welds with a standard deviation of 10 welds. In contrast, the first 5 hours produced 22 welds with no outliers, allowing daily capacity estimates and confidence bounds to be developed early in the evaluation. This early visibility helped separate throughput, active hours, productivity, and outlier effects, including the half-day task allocation on May 7 and the extended-hours output on May 6.
Averages alone are not enough for production forecasting; the underlying distribution of durations and cycle times also matters. In this case, weld duration itself was not significantly skewed, suggesting that the active welding task was relatively consistent. Cycle time, however, showed skewness toward longer durations because it included waiting, staging, setup, and other non-welding intervals between completed welds. Removing waits over 45 minutes, approximately four times the median cycle time, eliminated most of the skew and brought the mean and median cycle times within 1 minute. This matters because downstream planning risk, including the risk to downstream crews and schedules, depends not only on the average cycle time, but also on the frequency and impact of longer delays.
Next steps can be separated into two categories: (1) Real-Time Production Systems and (2) Expansion Beyond Welding.
A primary limitation of creating a real-time production control down to individual tasks is capturing quantity data frequently and accurately at low cost. This technology addresses that challenge for welding specifically. Production control could now be done dynamically in real-time calculating variances in cycle-times and durations as well as recycling the results to improve the model as is done in manufacturing.
Achieving this vision first requires evaluating a project with multiple weld designs – which is currently being tested at another facility, as well as within more complex workflows. Potential future applications include industrial turnaround projects or similarly critical projects such as life sciences or data center MEP scope. These projects have extremely high opportunity cost and any improvement in schedule is highly valuable. The two most important factors include identifying schedule slip early with quantified mitigations and using timelines to identify bottlenecks. For example, in a daily batch system excess capacity is not necessarily visible. Consider a system where pipe fit-up is completed the day before providing a daily inventory for the welders. A typical production measurement system may not be able to properly estimate capacity or utilization. Seeing at the task level can highlight areas for restructuring resources to maximize overall throughput.
Production system modeling in design requires data and assumptions on task durations. Having data at the unit level provides more accurate information on the distribution of throughput, variability, utilization, and cycle times. This will allow for better proactive control mechanisms such as constant work in process (CONWIPs). Alternatively, this could be framed as achieving the same level of accuracy over a much smaller period as discussed in the variability section.
Applied to production control, more accurate data would allow for visibility into changes sooner. An example could be implementing a new CONWIP to reduce cycle time on a particular activity. Visibility into the unit flow would show the changes to cycle-time that could be difficult to isolation amidst covariates at a daily level.
Any large project requires more than welding. To automate the progress data for production control would require expansion to other tasks. The underlying technology and systems used for welding are widely applicable to other tasks. It is possible that construction production measurement could be automatically measured in real-time. As a proof of concept, data collected from the main power line was used to assess activity. The welds captured were detected with over 85% accuracy through very rudimentary methods, suggesting significant opportunity for improvement. Detecting these required filtering of the various other activities concurrently happening in the shop which included wire brushing, grinding, charging cordless tools, compressors, and a host of other machines. Considering that the two most common activities, wire brushing and grinding, were identifiable amid multiple welders and other machines, it strongly suggests that measuring quantities outside of welding is feasible. Further work is required to understand the limits and tradeoffs of measuring other activities both individually as well as through disaggregation.
Putting automated production systems and expansion beyond welding together, the first logical step would be to pre-populate daily reports that feed production control. This would verify the results and provide valuable data to improve accuracy over time. In the field, this would reduce overhead reporting and streamline data collection for schedulers.
This paper demonstrates a passive, IoT-based system for automating production measurement of welding in real-time. Results were 99% accurate in quantifying the number of welds completed at a fabrication site over one week, validated against a single repeated weld design. Unit-level data presents several advantages over daily or weekly progress tracking. Notably, seeing the underlying distribution of durations and cycle times, combined with the minute level timing, provides far richer information for estimating and forecasting than daily or weekly summaries. For example, events such as rework or extended waits vary widely in frequency and impact depending on the underlying distribution, information that aggregate tracking obscures entirely. Collectively, these insights lead to better project decisions: more accurate targets and more informed mitigations.
Because the underlying sensing approach is task-agnostic, the framework implies that construction progress beyond welding could be captured in real-time through automation. One implication is that real-time production control down to individual increments of work may be feasible in the near future. Critical steps to enable that outcome include validating across bespoke designs in other field locations and applying to processes outside of welding.