Automation in early-stage infrastructure design remains limited in public sector contexts, where high-end digital tools are often inaccessible. In wastewater management, particularly Interception and Diversion (I&D) works, design workflows are still predominantly manual, leading to inconsistencies, delays, and suboptimal coordination across stakeholders.
To address these challenges, this paper introduces an Excel-based tool that automates the preliminary hydraulic design of I&D components, embedding Indian Standards (IS 6280, IS 6279) into its computational logic. The tool enables standardized design of screen chambers, grit chambers, and pump wells using simple user inputs such as flow, elevation, and pipe data. Outputs include key sizing parameters, BOQs, and equipment selection support.
Framed through the lens of Project Production Management (PPM), the tool’s performance is analysed against the five foundational levers: Product Design, Lead Time, Capacity, Inventory, and Variability. A case study from the Karaikal I&D project demonstrates time savings, repeatability, and reduced design variability. The paper further contrasts this approach with more advanced 3D modelling tools, clarifying the boundary between concept-level automation and detailed engineering.
This work contributes a replicable, low-cost alternative for semi-urban infrastructure design, offering production-aligned efficiency gains while maintaining regulatory compliance.
Keywords: Engineering Automation; Project Production Management (PPM); Interception and Diversion (I&D); Hydraulic Design; Excel-Based Design Tool; Infrastructure Standardization; Product Design Lever; Lead Time Reduction; Municipal Engineering; Civil Infrastructure Digitization.
Design automation has transformed many domains of engineering, yet civil infrastructure, especially public sector water projects, continues to rely heavily on manual processes. In Interception and Diversion (I&D) works—used to intercept wastewater from open drains and route it to sewage treatment plants—manual design approaches lead to delays, cost overruns, and inconsistent outcomes.
This paper addresses the gap by presenting a lightweight, Excel-based tool tailored to automate early-phase I&D designs. The tool uses embedded engineering logic drawn from Indian Standards (IS), ensuring compliance and consistency. It is positioned as a pre-engineering automation tool: one that supports rapid, structured, and scalable design, while not replacing detailed 3D or structural modeling workflows.
The research is framed using the five levers of Project Production Management (PPM), illustrating how design standardization and automation contribute to system-wide improvements in delivery time, resource use, and variability reduction. A real-world application in Karaikal, India, grounds the discussion and highlights the tool’s capabilities and limitations.
Project Production Management in Infrastructure
Project Production Management (PPM) is a framework that conceptualizes project delivery as a production system. Originating from lean manufacturing principles, PPM introduces a systematic approach to reduce waste, control flow, and optimize variability across project stages. The five key levers—Product Design, Lead Time, Capacity, Inventory, and Variability—serve as actionable points to align planning, design, and execution.
In infrastructure, these levers are rarely applied during the design phase, which is paradoxical considering that early decisions significantly influence downstream execution efficiency. Design not only defines physical configuration but also governs how resources, time, and workflows interact during construction. Integrating PPM thinking into design therefore represents a strategic shift toward production-aware planning in civil projects.
This research explores how a pre-engineering tool—built using Excel—can inherently reflect these PPM levers by standardizing design outputs, reducing manual effort, and improving resource predictability for I&D infrastructure.
Engineering Automation in Civil Design
While automation in mechanical and industrial design is well-established, its adoption in civil engineering is uneven. High-end platforms like Revit, Civil 3D, and BIM 360 offer parametric modeling and simulation but demand significant investment in software and training.
Municipal infrastructure design is often done using spreadsheets, paper sketches, and manual checks. This presents a critical opportunity for intermediate-level tools—automated, standards-driven, and executable in Excel—to fill the gap between manual and BIM-based workflows.
Related Work and Tool Positioning
Prior studies in engineering automation have focused on 3D-driven tools for transportation, urban drainage, and treatment infrastructure. Most of these tools require integration with proprietary platforms or GIS engines. While effective, they often lack backward compatibility or customization for small-scale infrastructure projects.
This paper positions the Excel-based tool not as a replacement for full-scale modeling, but as a preliminary automation layer. It operates upstream of CAD/BIM, providing standardized sizing, BOQs, and logical frameworks. This aligns with recent research advocating for distributed intelligence in infrastructure systems, where localized, adaptable tools augment traditional workflows in design and procurement.
The Excel-based tool developed for this study functions as a decision-support system for engineers working on preliminary I&D designs. Its methodology is structured around converting user inputs into technically compliant design outputs using a standards-based rule engine.
Scope and Design Philosophy
The tool is designed specifically for early-stage planning. It does not perform structural simulations, geotechnical verifications, or 3D modeling. Instead, it focuses on:
Inputs and Configurable Parameters
User inputs are limited to essential, measurable quantities collected during field reconnaissance or preliminary planning:
Computational Logic and Output Structure
Each subcomponent (screen, grit chamber, pump well) is linked to a backend logic table that contains:
Outputs include:
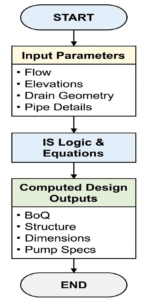
Figure 1: Tool Workflow Diagram
Exclusions and Boundaries
The tool does not perform:
It is intended to complement—not replace—professional judgment and detailed design packages.
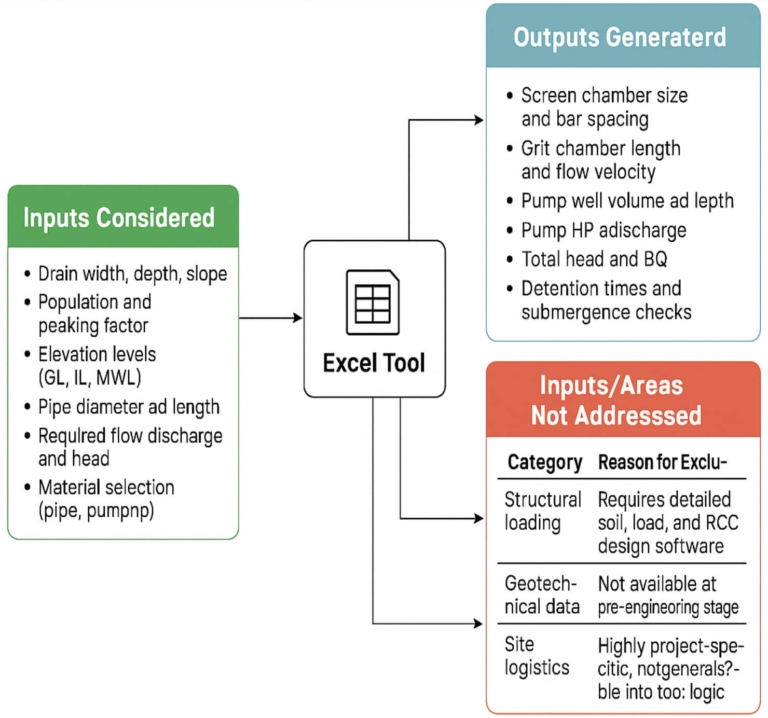
Figure 2: Input–Output–Exclusion Map
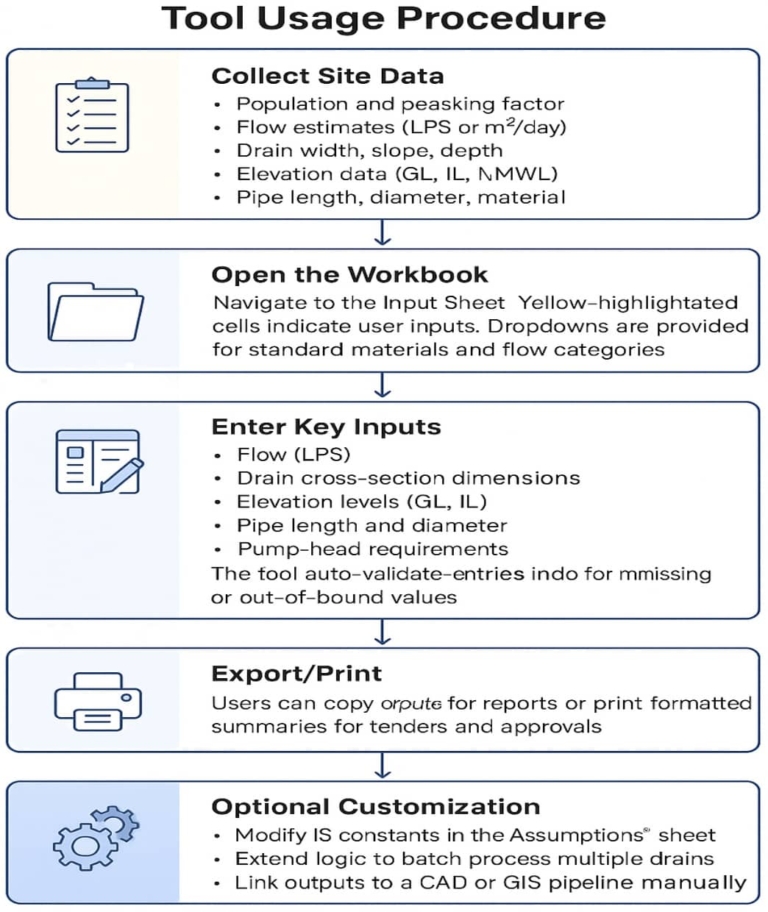
Figure 3: Tool Usage Flowchart
The Excel-based tool incorporates design logic drawn from Indian Standards and hydraulic engineering principles. It focuses on dimensioning core components of Interception and Diversion (I&D) works—namely, screen chambers, grit chambers, and pump wells—using standardized equations and parameter checks.
Screen Chamber Design
The screen chamber is the first line of defence against floating and coarse solid debris. Its efficiency depends on maintaining appropriate flow velocity, bar spacing, and head loss.
The tool calculates required screen chamber dimensions based on site-specific flow data, bar spacing, and effective area requirements.
Grit Chamber Design
Grit chambers are designed to settle heavy inorganic particles such as sand, gravel, and silt without removing lighter organic matter. Design is governed by principles of sedimentation and flow control.
The Excel tool selects grit chamber sizing to ensure sedimentation without re-suspension. It provides a warning if velocity exceeds recommended limits or if length is undersized.
Pump Well Design
The pump well (or wet well) collects wastewater and temporarily stores it before lifting it to the next treatment level. It is designed to hold peak inflows while maintaining minimum submergence to prevent vortex formation.
The tool calculates the required volume, recommends well diameter, and adjusts for minimum submergence based on pump type.
Pump Selection and Power Estimation
Pump selection is based on required discharge and total dynamic head. Efficiency assumptions are configurable but default to standard motor and impeller ranges.
The tool outputs horsepower (HP), flow rate, and head recommendations, helping engineers create a procurement-ready pump datasheet.
Validation and Warnings
The Excel backend includes logic-based error prompts:
Project Context and Challenges
Drain No. 17 in Karaikal, Puducherry, is a critical urban drainage line discharging into the natural watercourses. It traverses a densely built environment with narrow road margins, limited utility corridors, and severe spatial constraints. This context made it practically impossible to implement conventional side-mounted I&D structures, such as grit chambers or pump wells adjacent to the drain. Moreover, the site was characterized by unpredictable ground conditions, service line congestion, and stakeholder-imposed requirements to avoid visible disruption or excavation outside the existing channel width.
The engineering challenge here was twofold: (1) how to develop an efficient I&D system within the geometry of the existing open drain, and (2) how to do so rapidly and accurately, given the programmatic urgency to complete detailed design within days, not weeks.
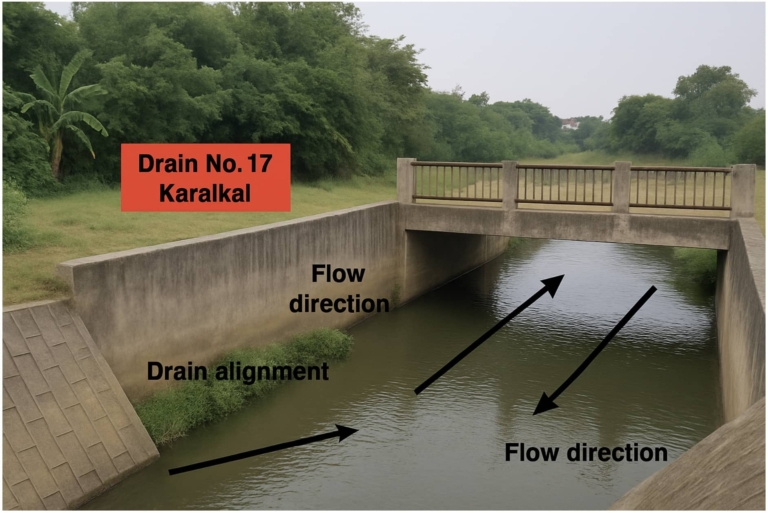
Figure 4: Site Photo – Drain No. 17, Karaikal with Flow Direction and Drain
Tool Deployment and Configuration
The Excel-based tool was utilized to develop an embedded solution within the existing drain structure. Key features include:
Field-Level Application and Adjustments
The tool allowed for rapid iterations in response to minor site-level changes. For instance, an initial assumption about available invert levels was invalidated by on-ground survey, prompting a recalibration of pump head and well depth—carried out within minutes using the tool. This case validated the tool’s flexibility, reliability, and alignment with site constraints, confirming its relevance in tight urban geometries where traditional workflows falter.
This section reframes the tool’s engineering output through the perspective of Project Production Management (PPM), demonstrating how the tool inherently addresses systemic inefficiencies common in civil infrastructure delivery.
Product Design Lever
The tool transforms infrastructure design from a bespoke engineering task into a configurable, template-driven system. Instead of independently sizing chambers and pumps for each site, standard component families are defined (e.g., pump wells in three size classes). This supports productization in public works, enabling modularity across multiple drains, reducing cost variability, and increasing interoperability of components.
Lead Time
Traditionally, hydraulic sizing, BOQ generation, and pump selection for I&D works require 3–5 days per site, including calculations, documentation, and validation. By encoding logic and standards, the tool reduces this cycle to 5–6 hours per drain. This ~75% reduction in lead time accelerates overall project progress, especially important when parallel drains must be commissioned concurrently.
Capacity
The tool optimizes capacity across engineering resources. A junior engineer can now perform tasks that previously required a senior designer’s attention. This liberates skilled personnel to focus on strategic design reviews, stakeholder engagement, and conflict resolution. It also allows multiple sites to be designed in parallel without requiring proportional increases in manpower.
Inventory
The tool improves alignment between design intent and material procurement. Over-sizing is avoided by matching dimensions precisely to required flows. This reduces the risk of excess pump capacity, unnecessary excavation, and overspend on concrete or reinforcement—particularly valuable in budget-constrained public works.
Variability
Manual design introduces variability due to interpretation differences and formula inconsistencies. By codifying the design process, this tool ensures that all outputs conform to the same standards regardless of who operates it. This promotes design repeatability, minimizes review time, and enhances trust between design and construction teams.
Positioning the Tool in the Engineering Automation Landscape
This tool represents a middle ground in the spectrum of digital engineering. On one end lie manual workflows—time-intensive and error-prone. On the other lie comprehensive BIM ecosystems, integrating design, simulation, and lifecycle planning. The Excel tool falls in between: it automates the calculative and regulatory logic but stops short of 3D modeling, structural checks, or geospatial analysis.
For many municipalities and contractors in India, where BIM is either cost-prohibitive or underutilized, such a lightweight yet standards-compliant solution offers a pragmatic alternative. It ensures design intent aligns with execution feasibility, without requiring new software investment or specialized training.
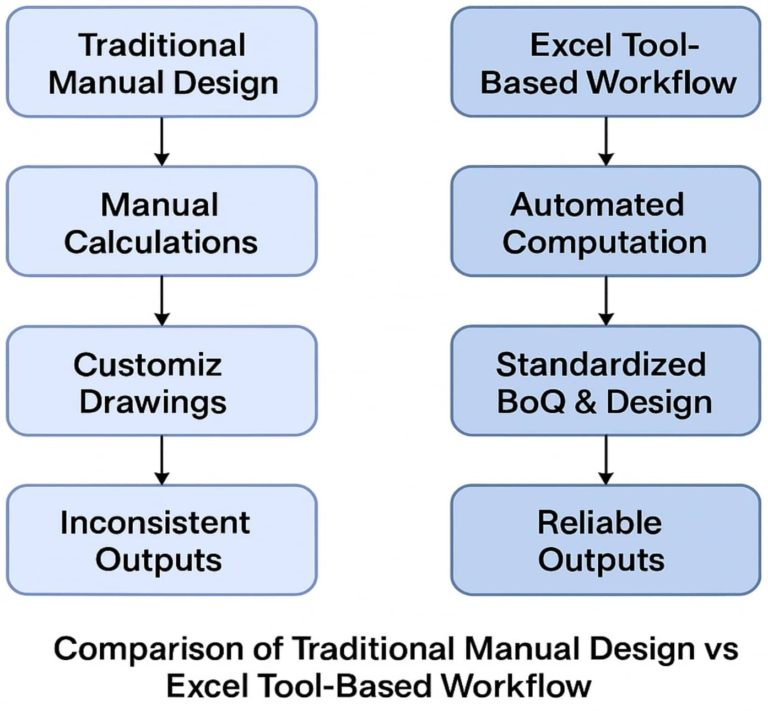
Figure 5: Comparison of Traditional Manual Design vs Excel Tool-Based Workflow
Designing for Execution, Not Just Performance
One of the key distinctions raised during tool evaluation was whether the tool supports “doing the work” — that is, whether it accounts for how physical construction is actually executed in the field. While the tool is not a construction planning software, it does incorporate critical execution-related inputs:
By embedding these physical parameters, the tool helps avoid overdesign — such as overly deep wells, oversized pump chambers, or infeasible slope profiles. It ensures that the resulting design is not just technically correct, but practical to build and maintain.
In this way, the tool supports a production-aware design mindset. It enables engineers to make decisions that reflect the constraints of actual construction work, bridging the gap between drawing-board logic and field execution. Thus, the tool advances an optimal design—not only in hydraulic terms, but also in how easily and efficiently that design can be built.
Limitations and Boundary of Application
The tool’s scope is clearly limited to preliminary hydraulic design. It does not:
Thus, it does not replace engineering judgment or detailed design validation. However, it complements them by ensuring the upstream logic is sound, uniform, and repeatable.
Feedback and Evolution
The tool has already undergone multiple iterations based on user feedback. One example is the recalibration of detention time formulas after pump suction failures in early sites. This feedback loop supports continuous improvement, ensuring the tool evolves in line with field conditions and engineering best practices.
Future enhancements may include:
Implications for Project Management and Public Works
By combining regulatory logic, automation, and production alignment, the tool offers a path for digitally transforming municipal engineering. It allows for:
Moreover, the integration of PPM thinking at the design stage is a shift in how public infrastructure is conceived. Instead of firefighting downstream issues, production-aware design pre-empts them—aligning project management with execution reality.
This study presents a replicable, Excel-based tool that automates the hydraulic design of I&D structures using Indian Standards. It delivers practical value in early-stage design while aligning with core principles of Project Production Management.
By embedding logic around flow, head loss, and constructability, the tool supports faster, leaner, and more reliable civil infrastructure delivery — especially in small- to mid-scale municipal programs.