Productivity trend graphs are often used to track progress (or lack thereof) for labor productivity improvement in the various industries over a span of several decades. Numerous sources representing Canada, the U.K. and the U.S. have compiled data to create such graphs. The most widely used graph to date was prepared by Professor Paul Teicholz of Stanford University in 2013. However, most of these graphs (including Teicholz’s) only focus on a timeframe of about fifty years, from the 1960’s through 2010’s.
Another exhaustive study on labor productivity of more than thirty major industries in the American economy was done by John W. Kendrick, covering the period from the 1900’s through 1960’s. Using the limited amount of data available during this period, Kendrick carefully defined the factors affecting productivity change and created a methodology whereby productivity can be accurately measured. His work is the first to systematically present estimates of productivity in the American economy and its major industrial sectors over an extended time period, as well as to analyze the impact that productivity changes had on the economy as a whole.
The article offers a broader perspective on the magnitude of the productivity problem in the ‘construction industry’ that has existed for over a hundred years ago by analyzing industry trends. Hence, by compiling the pre-1960 productivity trends as described in Kendrick’s book along with more recent research, we are able to complete the picture of lack of improvement in construction labor productivity since the 1900’s.
We recognize that the studies for the two eras, 1909-1957 and 1964-2012, are distinct and different due to the fact that not all data series have been measured in the same way over the time period from 1909 to present, as there have been significant changes and gaps in data, methodology and assumptions. Nevertheless, manufacturing industry output per manhour has increased 3.6 times more than construction productivity did during the period from 1909 to 1957, and 2.5 times more during the period from 1964-2012.
The term labor productivity, as defined by Paul Teicholz, is simply output per manhour. However, when measuring the output of an entire industry, output is defined by dollars of revenue (for a given base year) per manhour.
There are two primary sources of outputs in the Teicholz study. First, the Census Bureau (CB) that focuses on outputs and the dollar value of inputs. Second, the Bureau of Labor Standards (BLS) that focuses on labor inputs and many other measures of labor. In order to calculate labor productivity over a given time period while considering the effect of inflation, it is necessary to deflate ‘Current Dollar’ (real value) to a ‘Constant Dollar’ for a given base year using the appropriate index for the construction industry such as ‘Construction Labor Cost Index’ or the ‘Consumer Price Index’ used by Teicholz.
To compute the construction industry manhours, Teicholz multiplied the number of workers for each year by the annual hours worked, as collected by the BLS. Afterward, the labor productivity was derived from the calculated constant dollars divided by manhours for the total construction industry over the 1964-2012 period.
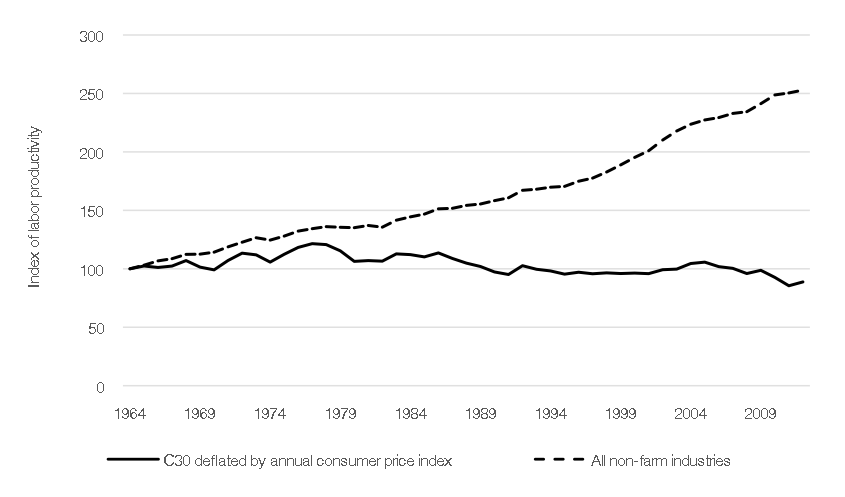
In the Teicholz calculations (Figure 1), the net impact over the 48-year time span shows that manufacturing productivity ended up about 2.5 times higher than construction productivity at the end of the period.
“A linear trend line shows a -0.32% per year decline (in construction labor productivity), while the trend for all nonfarm industries is positive 3.06% per year. The net impact over the 48-year time period is very significant.” ~ Paul Teicholz

Figure 1: Deflated C30 Series of Construction Vs. Nonfarm Industries Labor Productivity, (1964=100)
In this section, we will examine Kendrick’s findings on the labor productivity in the United States, analyze the results achieved, state all assumptions and reveal challenges faced by Kendrick to collect the data in order to produce the labor productivity index for an industry during this time period.
A main challenge of this work is to differentiate between the contract and total construction activities when calculating the construction industry Gross National Product (GNP). One solution was to use the available estimates of National Income originating in the contract construction industry by Kuznets[i] (starting 1919) and Department of Commerce (starting 1929). Kendrick used the below method to compute the GNP.
| National Income | + | Estimates of Capital Consumption | + | Contract Construction Share of Indirect Business Taxes | + | Other Reconciliation | = | Gross National Product (GNP) in the Construction Industry |
Then, by using the proper deflator, Kendrick was able to compute the output of contact construction alone for the period of 1909-1957.
The average number of employees per year is available from Commerce Department estimates in contract construction and was compiled as follows:

The average hours worked per week in contract construction is available from the Bureau of Labor Statistics (BLS) for 1946 and subsequent years. Estimates of average hours worked by employees in building construction were made by BLS dating back to 1934. The below timeline describes the method used to derive average actual hours for the whole period from 1869 to 1957.

As assumed by John Kendrick, since 1934 (excluding the period between 1942-46) there is a close relationship between ratios of ‘actual to standard hours’ in building construction versus ‘employment to labor force’ ratios in the construction industry. This relationship was used to derive the estimates of average actual hours per week from the estimates of full-time hours per week.
Similar to the Teicholz method, the product of average hours per week, number of employees and weeks per year results in the estimates of total manhours per year. Afterwards, Kendrick was able to calculate the output per manhour for the corresponding years. See the results below, as presented by Kendrick.
| YEAR | OUTPUT | PERSONS ENGAGED | OUTPUT PER PERSON | MANHOURS | OUTPUT PER MANHOUR |
| 1909 | 75.7 | 72.9 | 103.8 | 75.4 | 100.4 |
| 1919 | 56.3 | 63.4 | 88.8 | 62.1 | 90.7 |
| 1929 | 100.0 | 100.0 | 100.0 | 100.0 | 100.0 |
| 1937 | 61.4 | 75.5 | 81.3 | 63.7 | 96.4 |
| 1948 | 132.3 | 139.0 | 95.2 | 129.9 | 101.8 |
| 1953 | 174.1 | 155.4 | 112.0 | 143.2 | 121.6 |
Table 1: Contract Construction: Output, Labor Inputs, and Productivity Ratios (1929=100). Source: John W. Kendrick & Maude R. Pech (1961). Productivity Trends in the United States
The author has then adapted those results using 1909 as a base year in order to compare trends from 1909 onwards. The adjusted results are presented below in Table 2.
| YEAR | OUTPUT | PERSONS ENGAGED | OUTPUT PER PERSON | MANHOURS | OUTPUT PER MANHOUR | |||||
| 1909 | 100.0 | 100.0 | 100.0 | 100.0 | 100.0 | |||||
| 1919 | 74.4 | 87.0 | 85.5 | 82.4 | 90.3 | |||||
| 1929 | 132.1 | 137.2 | 96.3 | 132.6 | 99.6 | |||||
| 1937 | 81.1 | 103.6 | 78.3 | 84.5 | 96.0 | |||||
| 1948 | 174.8 | 190.7 | 91.7 | 172.3 | 101.4 | |||||
| 1953 | 230.0 | 213.2 | 107.9 | 189.9 | 121.1 | |||||
Table 2: Adjusted Base Year from Kendrick Output, Labor Inputs, and Productivity Ratios (1909=100)
Kendrick mainly focused his work on developing and categorizing productivity data by industry. However, he did not perform comparative analyses between industries such as construction versus non-farm industries, as did Paul Teicholz in his previous study.
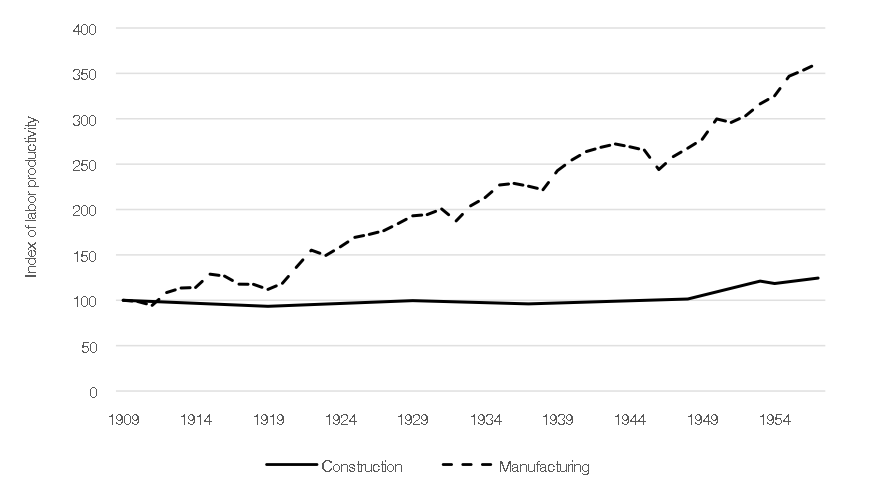
Therefore, if we compare the construction industry labor productivity data from Kendrick’s study for the period of 1909-1957, as derived in the above table, with the labor productivity for the manufacturing industry (data from Productivity Trends in the United States, p. 465, Table D-II) we can plot the results as presented in Figure 2 below. The graph clearly indicates a trend rate of increase in output per manhour for the manufacturing at an average of positive 5.4% per year, while the labor productivity for the construction industry is relatively flat over the same time period. The net impact over the 48-year time period shows that manufacturing productivity ended up about 3.6 times higher than construction productivity at the end of the period.

Figure 2: Deflated Manufacturing vs. Contact Construction Labor Productivity, (1909=100)
Kendrick acknowledged that there are inconsistencies in data sets, but he pointed out that his estimates are conservative.
“If…the productivity gains in the construction segment are understated by as much as one-third because of inadequate deflators, the true trend increase in output per manhour for Construction is closer to 1.3 per cent than to the 0.9 per cent indicated by Table E-1. But even with so major an upward adjustment, it is apparent that output per manhour in contract construction has increased significantly less, historically, than output per manhour in the private domestic economy as a whole.” ~ John Kendrick
Due to differing means of measurement and associated indices, a direct correlation between the work of Teicholz and the data derived in this paper from Kendrick’s study cannot be modeled. However, one can conclude that in general, construction industry labor productivity has not materially improved from the turn of the last century. This begs the question: what is the root of the construction productivity challenge?

An observed anomaly of increased productivity in a subset of construction industry over a 10-year period, based on the data in the Bureau of Public Roads index, is the total Highway Construction output per manhour from 1944 to 1955; there is evidence of significant buildup in construction productivity after 1945 during the post-World War II era (see Figure 3). The upward productivity trend characteristic of labor productivity is generally result of greater mechanization and improved machinery which indicates the importance of technological advancement.

Figure 3: Highway Construction Output per Manhour computed from estimated real highway construction expenditures and manhours employed (Presented in Bureau of Public Roads, Dept. of Commerce, Feb 1957, p. 152)
That being said, we must consider if the engineering and construction industry’s lack of progress is based on its acceptance and continued use of Taylor’s Scientific Management, in contrast to manufacturing’s adoption of and further building upon Ford’s system of Mass Production, including efforts by Toyota. If this is the case, until we rethink scientific management as the basis of managing construction, we will not see any gains.
[1] Paul Teicholz, “Labor Productivity Declines in the Construction Industry: Causes and Remedies,” AECbytes Viewpoint. Issue 67, March 14, 2013.
[2] John W. Kendrick & Maude R. Pech (1961). The George Washington University, Productivity Trends in the United States. New York, NY: National Bureau of Economic Research.
[3] Simon Kuznets, National Income and Its Composition, 1919—1938, New York (NBER), 1941 (p. 600)
[4] Daniel Carson, “Changes in the Industrial Composition of Manpower since the Civil War,” Studies in Income and Wealth, Volume 11, New York (NBER), 1949.
[5] Leo Wolman, Hours of Work in American Industry, Bulletin 71, New York (NBER), 1938 (p. 5)