For years now, project managers have been applying a methodology called Project Production Control (PPC) to assist them in delivering projects on time and under budget. While there have been several papers on how PPC is different from traditional project management methods, none have described these from a probabilistic/statistical viewpoint. This paper seeks to fill that gap.
Keywords: Project Production Management; Operations Science; Variability; Project Production Control
For more than a decade a new methodology known as Project Production Control, or PPC, has been applied to ensure that projects are completed on time and under budget. Despite this record, there is much confusion as to how and why PPC methods work better than traditional techniques such as Gantt charts and the critical path method. The purpose of this paper is to demonstrate why PPC methods work and how they can be applied to almost any project. See Arbulu, Choo and Williams (2016) for a complete description and discussion of PPC. [1]
Project Production Control applies principles that have been effective in the control of production in a manufacturing setting to the “production” of projects. Chief among these is the maintenance of a regular rate of production—sometimes called a “takt time.” [2] PPC does this by having local foremen commit to tasks that will be done the next day and then reviewing these commitments daily. The benefits of this practice are two-fold. First, it eliminates what is known as “Parkinson’s Law” [4] that states “the work expands so as to fill the time available” (see Parkinson, 1955 for the original humorous presentation and Izmailov et al. 2016 for a more serious discussion). [3] The benefit is psychological in that people find it easier to manage a frequent commit/review cycle as opposed to a long-term due date. It may be surprising to some, but people have a natural tendency to focus on near-term activities more than on a long-term goal. In other words, it is easier to maintain a rate than to hit a due date. The rate must be met every day; the due date only infrequently. Recovering from missing a long-term milestone is much more difficult than keeping up with a daily rate. One can work faster for a few days with less difficulty than to try and recover from a significant miss of a due date.
Second, daily (or even weekly) commitment/review cycles provide valuable information regarding the actual capability of the resources doing the work. The times given on most tasks on a Gantt chart are usually only a guess as can be seen by the high frequency of a small set of “rounded” durations (e.g., 1 day, 1 week, 2 weeks, etc.). The commit/review provides an enormous amount of capacity data at the lowest level. This data is invaluable for determining what is possible and what is not. Moreover, such data would be almost impossible to provide with any other method including expensive (and oppressive) time studies and questionnaires.
However, there is a third, more mathematical, reason for the effectiveness of PPC that appears to
have been overlooked in the Project Management literature. This will be the focus of the remainder of
this paper.
Consider a simple project as shown in Figure 1. Each task has only one predecessor.

Figure 1
If we look at who is doing the tasks, we see the following.

Figure 2
Now Nathan, Meredith, Brandon, Michael and Rachel are all good employees and want to do a good job. So, each of the tasks in Figure 1 have some padding added to make sure they are done on time. That way, Meredith will be sure that Nathan will have his task completed so she can get her task completed, so that Brandon can finish his, and so on.
Suppose the 5-day durations actually require only 3 days each with a 2-day buffer. Suppose this buffer ensures a 98% probability of finishing the task on time. If the times are normally distributed, this would imply a mean of 3 days, a standard deviation of around 1 day with two standard deviations guaranteeing the 98% on time. So, the total time to finish the project will be 5X5 = 25 days.
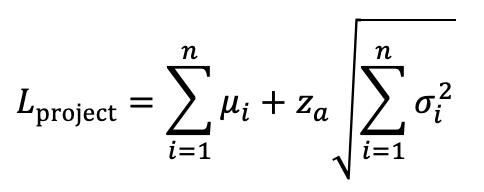
However, if we do not focus on each task but on the entire project, the picture becomes quite different. The mean time, μ, to complete the project is 15 days and the variance, σ^2, is the sum of the variances or 5 days. The standard deviation of the time to complete is the square root of this sum, around 2.23 days. The lead time requires two standard deviations to ensure 98% probability of finishing on time, hence,

Or, 28% less than the 25 days using the classic method.
If we had eight tasks instead of five, the difference would be even larger, around 35%.
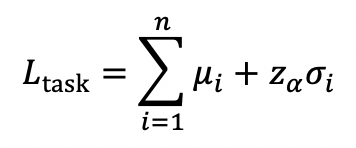
Suppose the mean for task ι is µι and the standard deviation is σι, ι = 1,… n. Let, za be the standard normal variate such that,

Then the lead time considering individual tasks will be,

while the lead time considering the entire project is,

If the means and variances are equal for all tasks the formulae become,
![]()
And

Since the actual time to complete the project is the same in both cases, ηµ, we can subtract these out and define the improvement as,

This implies that a 100-task project could be assigned a lead time buffer that is 1/10th the traditional buffer with the same probability of on-time completion. Moreover, if there were more than one predecessor for a task, the individual task lead times would increase even more. Thus, the above analysis indicates the minimum improvement in many cases.
It is also important to note that the amount of cash tied up in a project is directly proportional to the time it takes to complete the project. Since projects are rarely completed before the allotted lead time, reducing lead times can result in significantly smaller cash requirements which reduces borrowing costs and frees up money that can be used on other projects.
There are many reasons why PPC provides better control of projects than traditional methods. Some of these deal with intangibles, such as the psychology of managing rates versus meeting distant due dates. However, the analysis here is a mathematical one and can be characterized with a simple probabilistic statement: “variances add but standard deviations do not.” A significant consequence of this statement is that project lead times can be made shorter by focusing on daily local rates and overall lead times rather than task lead times and long-term milestones.