Supplier production and on-time delivery of material is a vital element of any major capital project’s success. Project management teams are often ignorant of supplier operations management practices and thereby suffer loss of major opportunities to improve project performance.
In this paper, we provide insight for project management teams into approaches in operations management and profitability that are common to suppliers, we address the underlying behavior of supplier capacity and we explore the tradeoffs suppliers make between capacity, lead time and profitability. We provide the reader with a more comprehensive understanding of how suppliers design and manage their production systems, including the use of ERP software. Key drivers of supplier performance are capacity utilization and management of tradeoffs between utilization, lead time and multiple customers’ priorities. Of particular interest is how suppliers improve profitability and cash flow through optimizing capacity. A supplier’s management of capacity is a prime determinant of the supplier’s ability to successfully supply materials to a project.
The paper closes with supplier management options that project management teams can employ to achieve better project cost and on-time delivery results.
Keywords: Capacity; Cashflow; Supply Chain Management; Project Management; Project Control
Supplier management is a key component of success for any Major Capital Project (MCP). In contemporary project management approaches, the title of the function may be Supply Chain Management (SCM) but usually the MCP SCM approach goes no further than perfunctory procurement practices. These include generation and evaluation of requests for quote, placement and monitoring of purchase orders based on pricing and lead times obtained from suppliers, and pushing out or expediting materials when inevitable project schedule changes occur. At the same time, MCPs are chronically delivered over budget and behind schedule. A major contributor to this poor performance is that project management teams are typically ignorant of suppliers’ internal operations management practices. In particular, ignorance of suppliers’ capacity planning and management practices can cause severe misalignment between supplier delivery and a project’s required raw material or construction requirements.
This misalignment has strong negative consequences for MCP delivery. As Handfield and Linton (Handfield & Linton, 2017) note,
“In so many supply chains, the different pieces of the supply chain are often misaligned. Information systems have, for years, tried to ‘integrate’ these disparate pieces, but this has still resulted in misalignment of decisions, primarily for political reasons. Every function has its own agenda, its own performance measures, and its own culture, and operates in a silo. Installing an ERP system to ‘Integrate’ these parts does little to address these disparities.”
Suppliers usually have different management incentive structures than MCPs. Suppliers’ monthly or quarterly measures of financial performance intensely affect executive evaluations of the business and its managers. In contrast, MCP managers are held to schedule and budget reporting standards, which are geared to achieving project completion over years-long durations. The standard project controls approach can be used to take out schedule slack or use contingency funds to show an MCP’s progress is on schedule and on budget until all project control options are exhausted and the project is acknowledged as irretrievably behind schedule and over budget. Getting to this point of acknowledgement often takes years for an MCP while the evaluation and reaction cycle is usually in the order of weeks, months or a few quarters for suppliers.
For nearly all suppliers, their revenue model is to charge for number of units produced. The more units they sell, the more money they make. They make more units by keeping their manufacturing capacity occupied as much as possible. Supplier capacity utilization therefore drives supplier profitability. There are many considerations for effective design and management of MCP supply chains including commercial terms, transportation logistics, safety, sustainability and compliance. We will concentrate here on the single most important determinant of supplier cycle time and delivery predictability: capacity utilization. MCP management teams can gain many benefits by understanding how suppliers plan and manage capacity utilization to drive profitability.
The focus here is on supplier planning and capacity management tactics as indicators of opportunities to improve project delivery performance. This does not just mean delivering the project on time and on budget; there are real opportunities in every project to reduce unnecessary use of cash, cost of managing and preserving inventory, cost of obsolescence and creation of surplus materials. This does not require project management to tell suppliers how to manufacture products—that is the supplier’s expertise. Realizing improvement opportunities may require working with suppliers on issues such as when and how much product to make and on conditions like build-ahead and the associated obsolescence risk. Project improvement opportunities can also be realized through collaboration with suppliers to set best desired capacity utilization across the entire Project Production System, including project site scheduling and control. Certainly, the project is the customer, but sometimes it makes more sense for project activities to be rescheduled depending on supplier capacity utilization. That is best accomplished by understanding supplier utilization ahead of time rather than attempting to address after capacity is constrained.
Understanding this requires both an Operations Science definition of capacity utilization as well as knowledge of the relationship of supplier capacity utilization to key project performance parameters such as cost and duration (i.e., cycle time). This article addresses the control systems and control techniques that suppliers use such as components of supplier capacity management. It contrasts production scheduling with project scheduling and provides insight into monitoring supplier capacity utilization as a leading indicator of project schedule attainment. Additionally, discussion is provided on suppliers’ internal profitability considerations and how those can be leveraged in project SCM negotiations.
Finally, we will discuss specific actions to measure, assess and manage supplier capacity utilization levels for best possible benefit to MCP cost and schedule.
Every project is a collection of production systems (Spearman & Choo, Rethinking the Product-Process Matrix for Projects, 2018) (Shenoy, 2017). The important insight from this observation is that activities and operations within a project can be designed for the specific type of production – typically the combination of volume and customization – taking place at that particular point in the project. A conceptual illustration of a project supply chain is provided in Figure 1. Every Project Production System is composed of capacity resources (equipment and labor), stock points, inventory (WIP or stock inventory) and activities. Supplier or subcontractor capacity resources can be used to make items for delivery to the site, items can be fabricated for use onsite and capacity is required for onsite installation activities.

Figure 1: Project Supply Chain Production Systems
Wherever there is a capacity resource displayed, there will be considerations of capacity utilization. Capacity utilization of one resource can affect inventory and timing for other resources. Capacity utilization of installation activities determines consumption rates of inventory and schedule milestone achievement. Further, project supply chain capacity considerations are vital in determining financial performance of the project.
Most projects are composed of numerous production systems operated by engineering firms, construction contractors, vendors and suppliers. A production system perspective enables understanding and optimization of Project Production Systems (PPS) through the application of Operations Science and Project Production Management (PPM). Traditional project management’s persistent failure in delivering projects on time and on budget points to a fundamental gap in understanding true Project Production System behavior. Production System Optimization (PSO), a component of Project Production Management, addresses this issue by providing and applying a scientific approach to optimize Project Production System performance.
From a PSO perspective, Operations Science shows that capacity utilization is a first-order parameter in determining cycle time.

Equation 1: Definition of Capacity Utilization
For both suppliers and projects, there are many legitimate concerns about levels of process variability or batch sizing of work or equipment reliability. However, if more work is scheduled (time used) than there is time to do the work (time available), nothing else matters—a first order effect. The work will not be completed whether variability is zero, batch sizes are as big as possible, or the machines never break down. Scheduling capacity utilization above available capacity essentially means planning for unattainable cycle times—bad practice for supplier performance and MCP delivery.
Furthermore, one of the largest components of cycle time typically is queue time. Queue time is the time a unit of production spends waiting to be processed at an operation or to be moved to the next operation (Hopp & Spearman, Factory Physics (3rd Edition), 2011). The VUT equation is a queuing theory expression of queue time for a G/G/1¹ queue.

Equation 2: VUT equation for Cycle Time in Queue
The left-hand side of Equation 2 is the time spent waiting in queue, or queue time. The right hand side of Equation 2 shows that queue time is the product of three factors – V(ariability), U(tilization) and T(ime) – hence the acronym VUT. The factor V contains ce2 and ca2, which are the squared coefficient of variation for effective process time and interarrival time respectively. The factor U contains a term in u, where u is capacity utilization as defined in Equation 1. The T time term is simply te , the effective process time. Understanding the behavior of queue time is essential to good project management and to good supplier management. Figure 2 shows how queue time behaves with changes in utilization (U) and variability (V).
The insights from the VUT equation are profound in their implications to project and supplier management. We name two primary insights here. First, trying to operate at 100% utilization is a recipe for disaster. In that scenario, u = 1 and queue time blows up out of control. From a project accounting perspective, 100% utilization appears to be a good goal, but in practice, it is guaranteed to drive any Project Production System out of control. Second, there are interactions between variability, utilization and process time that dictate prudent use of capacity as a buffer to prevent excessive cycle times. Variability is manifested in any number of ways in projects, including weather conditions, design changes, equipment reliability, material quality and work process repeatability. The effect of variability on supplier delivery and project duration is further illustrated in Figure 2.

Figure 2: Utilization and Variability Interaction
Supplier lead times and project duration blow up much sooner in high variability environments. This is the natural effect of queue time modeled by the VUT equation and is a fundamental characteristic of all Project Production Systems.
Another common characteristic of supplier production systems is that the lead times promised to project teams are usually much longer than the actual cycle time required to produce the material for the project. We distinguish between cycle time and lead time, as cycle time is the average time from when work is released to a process until the time the work finishes the process (Hopp & Spearman, Factory Physics (3rd Edition), 2011, p. 230). Cycle time is a random variable resulting from a combination of capacity utilization, variability and work-in-process. Lead time, on the other hand, is the time allotted by a supplier for the production and delivery of the part or equipment ordered (Hopp & Spearman, Factory Physics (3rd Edition), 2011, p. 230) Lead time is a deterministic management parameter. Service level is the probability that cycle time is less than or equal to lead time. See Zabelle and Parsons (Zabelle & Parsons, 2017) for an in-depth description of the relationship between cycle time and lead time. A key source of leverage for improving project delivery performance is determining what the actual supplier cycle times are, given a supplier’s capacity utilization, and how those cycle times correspond to the lead times promised to the project team.
In the case of long lead time engineered-to-order (ETO) materials, capacity utilization is a primary consideration. Operations Science shows there are only three buffers for variability: inventory, capacity and time. For ETO material, inventory is not a buffer option. ETO items, such as a subsea tree for an underwater wellhead, are produced uniquely for the intended application. A company would not make and stock twenty subsea trees with the hope that that they will be sold on a regular basis. As a result, only capacity and time can be used to buffer against variability when trying to synchronize supply and demand of subsea trees. The implication is that the right amount of capacity utilization should be planned for ETO products, or MCPs will be left with the only buffer available, which is time. This is in contrast to made-to-stock (MTS) materials such as piping which are sold over and over, and so suppliers maintain large quantities on-hand available at very short lead times of days or weeks.
Capacity utilization is a fundamental determinant of supplier performance, which is of primary importance in project delivery success. Accordingly, there is a major opportunity for project teams to improve project delivery performance by understanding and monitoring supplier capacity management and working with suppliers in cooperative efforts to synchronize production and delivery of supplier material with project requirements.
There are many differences between conventional project control practices and supplier production control practices. These differences have grown primarily out of project management practices, as institutionalized by the Project Management Institute (PMI). These practices were developed without consideration of Operations Management practices (Project Management Institute, 2017) and Operations Science concepts to understand and control project behavior. This exclusion of Operations Management and Operations Science from the scope of what is considered traditional Project Management is based on the perception that classic manufacturing management and control is only for repetitive production of material whereas projects are always one-off endeavors to which repetitive manufacturing concepts do not apply. Further, in classic manufacturing, items move through stations or operations while projects are usually fixed site construction in which materials are transported to the site and the end “item,” such as a hospital or data center, is built in place. The differences are indeed significant, but the failure to recognize projects as a collection of production systems, and thereby subject to the laws of Operations Science, has caused extreme dysfunction in many project management and control practices.
We next provide an overview of supplier production and planning systems and a comparison of production schedules with project schedules for the purposes of understanding, monitoring and managing supplier capacity utilization to improve project delivery and cost results.
Suppliers very rarely use Primavera or Microsoft Project for managing production. Suppliers in manufacturing, whether ETO or MTS manufacturing, use some form of Enterprise Resource Planning (ERP) systems. There is extensive literature on ERP systems and a detailed discussion of ERP is beyond the scope of this paper. However, it is important to note that within every ERP system is an application called Materials Requirements Planning (MRP) used for managing daily production. See Figure 3 for further illustration of MRP hierarchy elements. Please note that in the decades since MRP appeared with the advent of the computer age, IT companies have generated many variations of the basic MRP hierarchy described herein.
Following is a brief description of each Figure 3 MRP element as defined in (Hopp & Spearman, Factory Physics (3rd Edition), 2011).
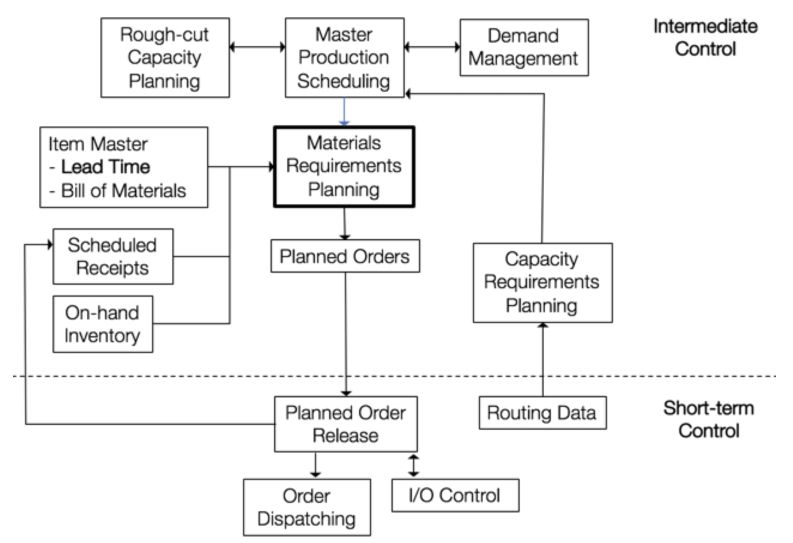
Figure 3: Intermediate and Short-Term MRP Planning
Demand Management – This is a combination of forecast orders and firm orders for each item a business sells. A primary function of demand management is forecast consumption. This is the process of netting firm orders that are received from customers against existing forecasts in the system. For example, if a company has a forecast demand of 10 pieces of Part ABC per month for the next 6 months and receives a customer order for 4 pieces in month 5, the net demand for month 5 is still 10 but the forecast demand is reduced to 6.
Master Production Schedule – This takes the demand forecast along with firm orders from the demand management module and, using aggregate capacity limits, generates an anticipated build schedule at the highest level of planning detail. These are the “demands” (i.e. part number, quantity and due date) used by MRP. Thus, the Master Production Schedule (MPS) contains an order quantity in each time bucket for every item with independent demand, for every planning date.
Rough Cut Capacity Planning – This is used to provide a quick capacity check, before MRP processing, of a few critical resources to ensure the feasibility of the MPS. Rough Cut Capacity Planning (RCCP) is less detailed than Capacity Requirements Planning (CRP) which is another test for capacity feasibility after MRP processing. RCCP makes use of a Bill of Resources for each end item on the MPS. The Bill of Resources gives the number of hours required on each critical resource for each end item.
Capacity Requirements Planning – CRP uses MRP-generated production plans to provide a much more detailed capacity check than RCCP. Necessary inputs include all planned order releases, existing Work-in-Process quantities, routing data (i.e. process flow), as well as capacity and lead times for all process centers. As originally constructed, CRP was not true finite capacity analysis, as it performed infinite forward loading. CRP predicted job completion times for each process center, using given fixed lead times, and then computed a predicted loading over time. These loadings were then compared against available capacity, but no correction was made for an overloaded situation. Correction was left to the production planner. Contemporary planning systems have incorporated more optimization and automated re-planning capability, but often are still hampered by the original deterministic lead time structure.
Item Master – The item master file is organized by item number and contains, at a minimum, a description of the item, Bill of Material (BOM) information, lot-sizing information and lead time for the item. The BOM data for an item typically list the components and their quantities that are used only to make that item.
Scheduled Receipts – This file contains all previously released orders, either purchase orders or manufacturing or fabrication work orders. Scheduled receipts are netted against demand for the period in which they are scheduled to be received.
Materials Requirements Planning – Simply stated, MRP planning starts with item demand, nets out existing on-hand inventory, takes into account timing of scheduled receipts either from suppliers or from internal production and then sets lot sizes for remaining production requirements. These production requirements are then offset against the internal lead time for the material’s production. Note that these internal lead times are also inputs into the MRP system as part of the Item Master (see Figure 3) and supplier personnel often do not take into account their own capacity utilization or WIP levels when determining these lead times. Finally, a BOM explosion is completed to generate required component demand throughout the lower levels of the BOM.
Regeneration of MRP production plans are scheduled weekly, daily or even twice daily.2
A couple of quick checks when evaluating suppliers are whether or not the lead times in their planning systems are adjusted based on capacity utilization and if they control WIP releases to their production process based on the amount of WIP in the process (i.e., never let WIP levels rise too high). A project team should proceed with caution if the supplier does not practice either of these in production planning and control.
The outputs of an MRP system includes planned work orders, change notices, and exception reports.
Planned Orders – These are MRP requests for an item including the expected date the item is required and the quantity required. Since the orders are only in a planned status, the due dates and quantities can be adjusted by MRP depending on changes to demand quantities or due dates. Planned Orders can be Purchase Orders placed with suppliers or Work Orders for production.
Change Notices – Messages indicating modifications required of existing scheduled receipts such as changes in due dates or priorities. Moving a due date earlier is called expediting while making a due date later is called deferring or pushing out.
Exception reports – This provides a notification to users that there are discrepancies between what is expected and what will transpire. Examples include inventory (WIP, finished goods or raw materials) count differences, imminently tardy jobs and missing data.
On a weekly or daily basis, planners or MRP may perform an order release function and then whatever orders are released must be managed.
Planned Order Release – This converts planned orders to scheduled receipts. Scheduled receipts can be either purchase orders or manufacturing or fabrication work orders.
Order dispatching – For production or fabrication work orders only. The process of developing and executing rules to arrange the queue in front of each workstation to meet required due dates while keeping workstation utilization high and cycle times low.
I/O Control – Proposed as a way to keep cycle times under control. Monitor WIP levels and adjust release rates up or down as needed by changing the MPS. Unfortunately, waiting until WIP levels are out of control is waiting too long. The advent of WIP control systems (i.e. “pull” systems such as CONWIP or Kanban) addresses this shortcoming.
Next, we consider the all-important project schedule and a comparison to production schedules.
Understanding the difference between an MCP project schedule and a manufacturing production schedule is key to understand and successfully manage supplier capacity utilization. Suppliers do not manage their production the way project teams manage projects. A production schedule for a supplier is not the same as a project schedule for a project yet many project teams assume they are.
A major difference between project schedules and supplier production schedules is that suppliers commonly update their production schedules much more frequently than project schedules are updated, as seen in Figure 4. This corresponds also to the frequency of revenue generation. For MCPs, there is usually an enormous amount of money that is spent over months or years to generate an asset (e.g. oil well, hospital or data center) that only produces revenue after the asset is built. For supplier production, the supplier commonly has assets in place that are continually creating revenue producing items (e.g. drill pipe, pumps, or concrete).
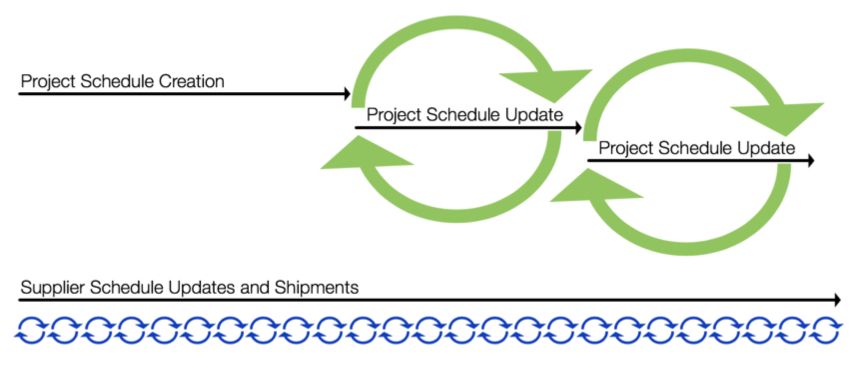
Figure 4: Conceptual Comparison of Project Schedule and Supplier Production Schedule
A project schedule is an output of a schedule model that presents linked activities with planned milestones, dates, durations, and resources [4]. A schedule for a capital project is most often created using the critical path method (CPM) and issued as a Activities List, a Bar (Gantt) chart, as seen in Figure 5, or a Network Diagram.
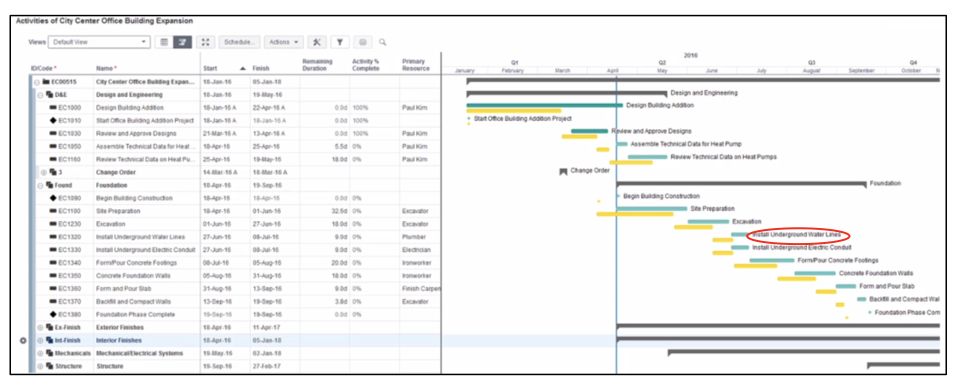
Figure 5: Project Schedule in Gantt Chart Format (ORACLE Corp., 2019)
In the project schedule in Figure 5, the red circled task is installation of underground water lines. For an example, assume 1200 meters of ductile iron pipe is required for the water lines. The installation is supposed to start at the end of June. The supplier requires a 6-week lead time for the piping, so the project SCM team must place its order by the middle of May to ensure the pipe arrives on time. What usually happens is that the SCM team places its order much sooner, perhaps in January, because the budget for the project was approved in December and the project manager would much rather have the inventory onsite as soon as possible to avoid delays due to material shortage. This early stockpiling of inventory is commonly very harmful to project delivery goals—for more details, see Spearman and Choo (Spearman & Choo, Unintended Consequences of Using Work-In-Process to Increase Throughput, 2018). Whatever the requested delivery date, the pipe supplier’s production schedule looks much different than the project schedule.
An example supplier MRP schedule for pipe production is illustrated in Figure 6. The first thing to notice is that the lead time in the supplier’s production schedule is four weeks but, as described, they are promising a six-week lead time to the project. Another thing to note about any supplier’s schedule is that that suppliers are usually making product for many different customers. The project requires only 1200 meters of 335 psi DR 7.0 18” nominal pipe. The supplier casts the pipe in industry standard six-meter lengths. There are many different characteristics of pipe, so rather than scheduling each requested combination of pipe size, alloy and coating, the supplier’s initial schedule is in tonnes per week of pipe. The project’s order of 1200 meters only translates to about 124 tonnes of pipe, not even half a week’s production.

Figure 6: Supplier Weekly MRP Production Schedule for Ductile Iron Pipe
While it’s good to know what suppliers’ internal lead times are compared to their published lead times and where the project’s order is in comparison to other customer orders, the most important characteristic of supplier management is still supplier capacity utilization. If the supplier is willing to share their internal schedule with the project SCM team, it can be very informative for helping SCM determine the supplier’s ability to provide material to the project on time. It’s common for suppliers to be reluctant to share this information but some of the reluctance can be addressed by only requesting total demand per period in the schedule (forecast and actual orders) and historically demonstrated production quantities. This will allow for a rough utilization analysis.
Operations Science influences MRP mechanics, and supplier scheduling practices all contribute to supplier behavior in providing material to MPCs. The final piece of the MCP supplier capacity management puzzle is the financial reporting and control practice of the supplier. Next is a brief discussion of a few of these practices and how they tie with previous concepts before concluding with recommended best practices for MCP supplier capacity management.
MCP suppliers that provide repetitive manufacturing or fabrication products and services are on different financial control structures than MCPs. Suppliers typically use standard financial cost accounting practices, which differ appreciably from project accounting practices. Financial reporting requirements usually drive suppliers to report monthly on expected production against targets and to determine profit per unit by subtracting unit cost from unit sales price. Determination of unit profits and monthly reporting requirements influence supplier capacity management and can provide clues to expected supplier behavior.
The basic model for calculating unit profits is straightforward. Take unit sales price, minus any discounts, and subtract out unit costs. While unit sales price is also straightforward, standard unit cost is a little more complicated. Standard cost accounting uses two basic cost categories: fixed costs and variable costs. Fixed costs such as wages, utilities or building leases do not change much with variations in production quantities. Variable costs such as raw materials or packaging are directly related to variation in production quantities.
The Standard Unit Cost Model is stated as

Equation 3: Standard Unit Cost Model
Where x is number of units produced.
This is a tried and true accounting model for allocating costs to products. The problem is that it is a poor model for representing actual behavior of production systems. The Standard Unit Cost Model tells accountants that the best way for reducing unit costs is to make as many units as possible to decrease the fixed cost component of unit cost. As was discussed earlier, the VUT equation (Equation 2) provides an accurate model of production system behavior.
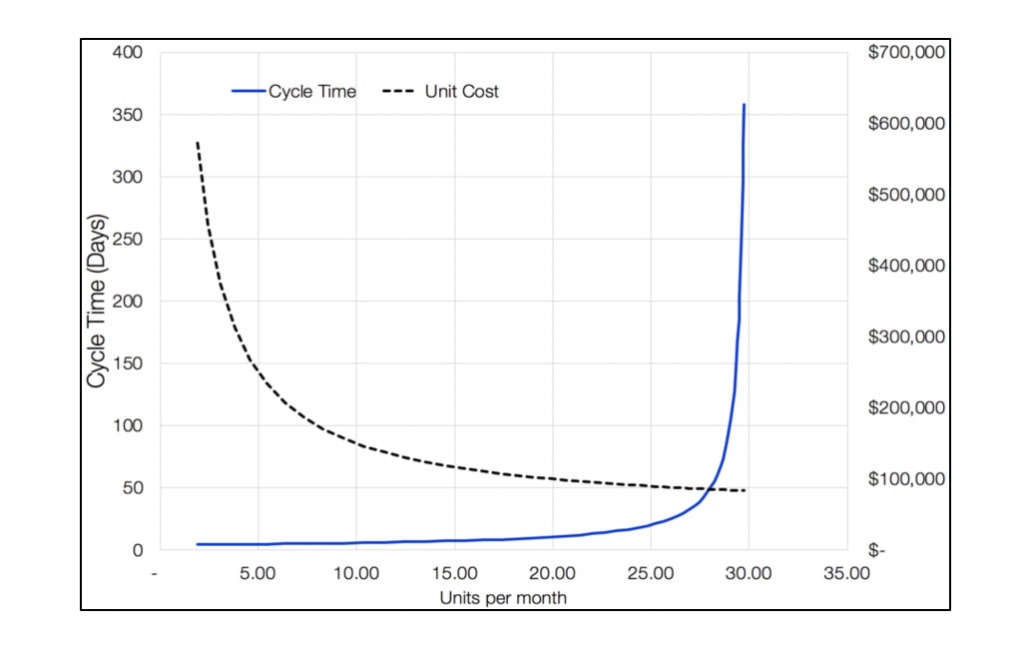
Figure 7: Unit Costs and Cycle Time (Spearman, Chart Provided by Dr. Mark Spearman, 2019)
Figure 7 demonstrates common behavior in the relationship between unit cost and cycle time. Pushing production to highest levels possible provides very minor reduction of unit costs but drives cycle times out of control. Often this standard cost accounting focus motivates supplier organizations to drive high levels of utilization all the time, which results in poor production control and high unpredictability of deliveries. For the supplier organization, it also means higher internal costs which translate to higher costs to the project.
Monthly reporting requirements, particularly in combination with a focus on maintaining high utilization, often drive supplier companies to exhibit “hockey stick” production behavior. A hockey stick graph is flat in the beginning but slopes up gradually and then sharply towards the end. Figure 8 illustrates a month’s production exhibiting hockey stick behavior.
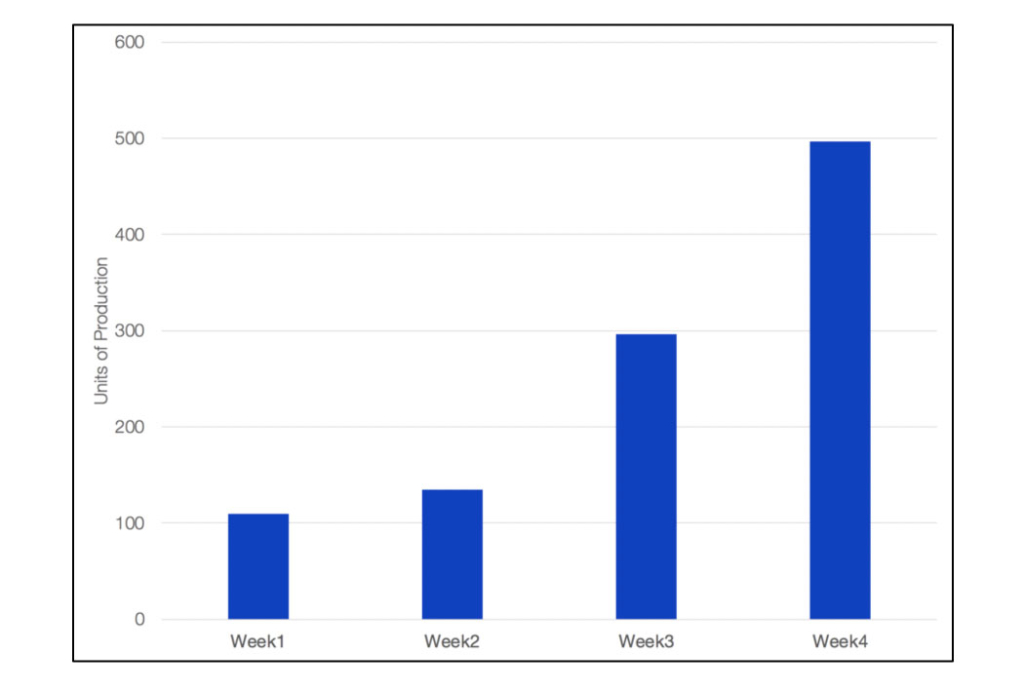
Figure 8: Month Production Results
This behavior happens because the supplier’s production system is not well controlled. At the end of the month, the operations management style is “all hands on deck” with overtime and lots of expediting to make the monthly production numbers. Once the month is finished, overtime is restricted, work returns to a slower pace, jobs that were close to being completed were completed in the previous month, remaining jobs will not be finished in the first part of the next month – and the pattern starts all over again. Seeing hockey stick production results is another clue that the supplier might not have the best delivery or cost performance and should be evaluated carefully before selection is a project supplier.
There are a number of best practices for managing MCPs’ supplier capacity but, as stated earlier, they all start with obtaining a good sense of the supplier’s capacity utilization levels—capacity utilization is a first order effect. Also described were some of the mechanics of suppliers’ capacity scheduling practices and how those differ from project scheduling and control. In conclusion, the following best practices build on those concepts to enable successful supplier capacity management in support of project delivery goals.
[1] Using Kendall’s notation, a G/G/1 is a queueing model of a single server station having generally distributed (e.g. normal or uniform) interarrival times of jobs and generally distributed job process times.
[2] Here is where companies often abuse their technology. Just because MRP can generate literally thousands of exception messages daily or twice daily doesn’t mean an organization can respond to them all. This type of over-control actually makes things worse. One large company hired inexpensive Indian labor to respond to the thousands of messages generated each week by the company’s MRP system. This did not eliminate delivery problems.