Over the period 2014 to 2018, US unconventional operators reduced well breakeven costs in response to oil prices falling from a median price of $76/barrel in 2014 to just under $50/barrel in 2018. As oil prices begin increasing again, investors question whether these cost reductions are genuinely sustainable, achieved by long term structural changes or whether they are cyclical in nature, and therefore temporary. An analysis of publicly available data indicates that operators do not have the tight control on operational performance and costs suggested in earnings calls. We show that substantial improvements are possible with a thoughtful application of Project Production Management principles to unconventional onshore field development. Our estimates suggest that unconventional operators could unlock up to $10 billion of cash in their operations, which could be reinvested to $65 billion of potential revenue.
Keywords: Inventory; Work-in-Process (WIP); Variability; Factory; Well Production System
The US oil and gas industry responded to the 2014 price crash by significantly reducing well breakeven costs across liquids unconventional plays from a median of $76/barrel in 2014 to just under $50/barrel in 2018. While this achievement has been praised by investors, many are concerned that the cost reduction was cyclical rather than structural and that the industry will revert to old habits now that oil prices are rising. The current challenge for the industry is to generate sustainable free cash flow in support of competitive returns to shareholders. To do that, operators must ensure tight and sustained control over how much of their cash is tied up in the well production system.
Analysis of public data implies that operators do not have as tight a control on costs, cycle times and the efficient use of cash as they often suggest in investor presentations. Frequently, they reference only the best-performing wells in the best areas rather than the operating and financial efficiency of the overall well factory. We estimate that at least $26 billion in cash is tied up in the well factory, or well production system, in the form of drilled uncompleted wells (DUCs) alone (as defined by the EIA). We recognize that some level of capital will always be tied up in the form of drilled uncompleted wells, and that there are a variety of reasons for this including strategic choice. However, as described in a recent article by Wood Mackenzie (Wood Mackenzie, 2018), Strategic Project Solutions, Inc. (SPS) has found that operators can unlock up to 40% ($10 billion) of this cash simply by optimizing the well production system.
If utilized efficiently, the $10 billion of unproductive capital could deliver an additional 1,000 to 1,500 producing wells which translates into a staggering $40 to $65 billion of revenue (real terms) over the life of the field. Alternatively, operators can use the cash released for debt reduction or return it to shareholders via buybacks and/or dividends.
While these numbers are large in terms of value, we believe this is just the tip of the iceberg. For this example, we are only calculating the impact of DUCs and do not take into account the billions of dollars of cash tied up in other activities in the well production system (e.g. engineering, land/permitting, field development plans, etc.) We believe this value leakage is a substantial issue for the industry, and that operators can and must do better to manage it.
Unconventionals have become the success story of the oil and gas industry, helping the US to become the largest gas and liquids producer and the world’s most flexible oil producer. The companies developing unconventional reservoirs, mainly the US upstream independents, pursued a different approach to field development than the industry has historically taken. Following the price crash in 2014, operators undertook multiple initiatives to reduce costs and become more efficient. These included negotiating lower service and equipment costs, improving productivity through technology/learnings, reduced headcounts, de-scoped or deferred investment, and drilling their more productive well locations first (including those nearest to infrastructure).
The improvements led to the industry successfully working on both sides of the breakeven equation: higher field and well productivity as well as reduced costs. As a result, the median wellhead breakeven cost in US unconventional liquids plays has fallen by almost 35% from $76/barrel in 2014 to $50/barrel in Q2 2018 as shown in Figure 1. However, this reduction in breakeven cost is still below the ~50% drop in oil price from 2014 to 2016.
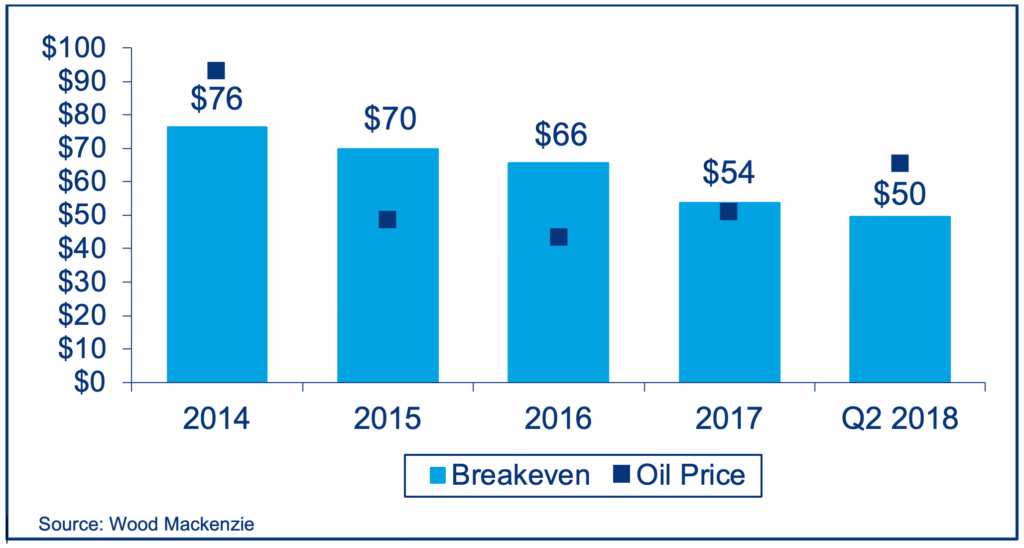
Figure 1. Opportunity Lost? Median WTI Breakeven Cost for US Unconventionals versus Oil Price
Interestingly, many operators claim that the driving force behind achieving the reduction in well breakevens was the application of a well factory or well production system. The analogy being drawn is comparing the fabrication of many producing wells tied up to infrastructure in an oilfield with the mass production of automobiles. We argue that the comparison to a ‘factory’ model does not adequately recognize that there are significant differences in the variability encountered in “manufacturing” wells, compared with making cars. We therefore conclude the gains to date made by operators are largely a result of cyclical improvements and incremental efficiencies rather than the structural change required to deliver the full benefits possible from a true well factory approach. As a result, most operators do not have an integrated, efficient well factory and the public data reflect this, as we show.
The observation that unconventional field development might be susceptible to a “factory” approach is a very worthwhile one – there is a high amount of repetition in the operations undertaken to drill and complete wells over and over again, and it makes perfect sense to look to the science of operations or manufacturing to understand how to optimize field development. A standard reference for the science of production or operations is (Hopp & Spearman, Factory Physics (Third Edition), 2011), which gives a thorough description of different types of production systems, and their optimization. An important target for production systems, particularly those making multiple units, is to achieve repeatability or consistency i.e., achieving uniformity of products output with little variability. More generally, variability in the context of a production system is defined in (Hopp & Spearman, Factory Physics (Third Edition), 2011) as non-uniformity or variation in operating parameters that occur in the course of executing the work activities.
High variability in costs and development time is one reason we conclude that operators do not have a fully functional and efficient well factory under control. Figure 2 shows an example of the variability of time it takes for one operator to ‘produce’ or deliver a well through the well production system. The chart shows the average, the standard deviation and the minimum and maximum cycle times for each operation. Drill time, for example, took an average of 48 days and had been as low as 10 days and as high as 165 days, with a standard deviation of 30 days. This variability exists in any well production system, but investor presentations often do not reflect this reality. The failure to understand and address this variability and its consequences results in higher costs and the inefficient use of time and cash. A properly designed well production system would implement measures to reduce the variability.
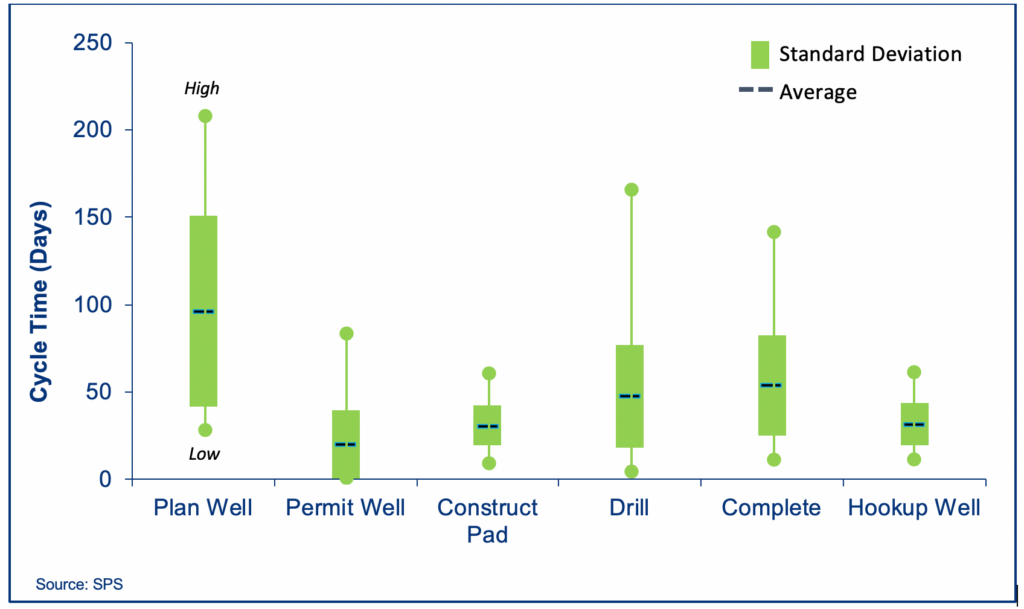
Figure 2. Variability in Cycle Time for Key Functions of and Example Well Production System (One Operator in One Play for Similar Wells)
If we take a closer look at well data across operators in the same sub-play over time, we see a similar picture with significant differences in cycle times across operators. Figure 3 shows the range of days and the median days between the end of drilling and the end of completion for a sample set of operators in the Midland ‘Deep Basin’ sub-play over time (includes Howard, Midland and Martin counties).
While the median days are quite similar across players and time, the variability inherent in their current production system is significant. Operator C appears to have the tightest control over its cycle time, with low variability and a competitive median. Operator D, on the other hand, shows high variability in its operations. While some of the observed variability is good, as it recognizes design changes or operating changes which add value to the business, we also argue that too much variability is bad, creating complexity and inefficiency in UC operations. This variability can also increase costs and development time, which results in unnecessary locked-in cash.
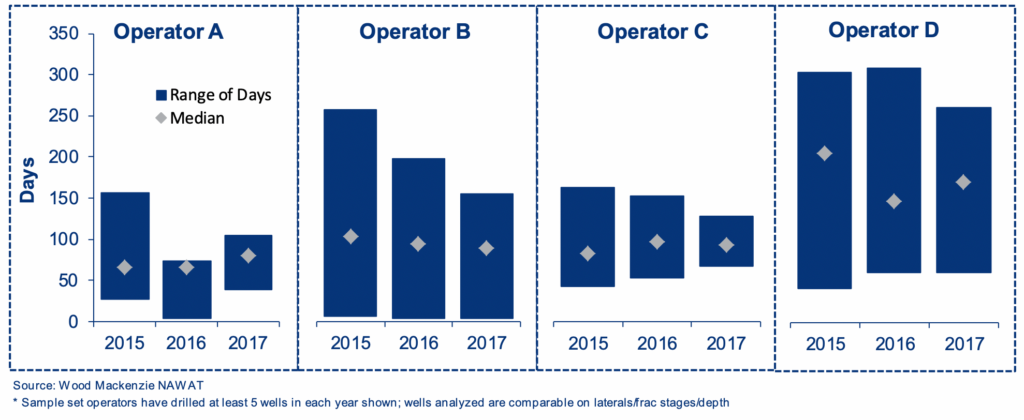
Figure 3. Variability of Time between Drilling End and Completion End for Sample Set of Operators in the Deep Basin Midland Sub-play
An efficient well factory reduces cycle time which increases project value and frees up capital. With the variability we are seeing in cycle times today, both within one operator in one play and across all operators in the same play, these factories are clearly not as efficient as they could be.
We stated as we opened this discussion that UC developments have trapped at least $26 billion of cash, of which $10 billion could rapidly be made available for re-investment or returned to shareholders. To get to the $26 billion, we looked at the current level of 8,000+ DUCs across the US multiplied by an average cost of $3.2 million for all well costs excluding completion and tie-in. Based on the experience of SPS in modeling, optimizing, and controlling well production systems, we estimate that up to 40% of this cash ($10 billion) could be recycled back into the business or returned to shareholders. The opportunity cost of not reinvesting that $10 billion of cash is $40 to $65 billion of lost revenue.
Efficient factories generate only the inventory necessary to ensure a smooth flow through the factory, and variability disrupts this flow. Excessive inventory before or after any operation is an indication of system inefficiency. In this example, DUCs represent one type of unnecessary inventory within the well production system. Assuming the operators of these wells would not consciously choose to tie up $10 billion in unproductive capital (if so, investors may wish to challenge the value of these strategic choices), these DUCs are a symptom of an inefficient well production system.
In other industries, factory and system characteristics such as variability are modeled, optimized and controlled through the application of operations science (Hopp & Spearman, Factory Physics (Third Edition), 2011). Efficient manufacturers are systematic and relentless in their pursuit of higher quality products at ever reducing cost and faster time to market. This is an “and world” regardless of the external market environment. We believe there is sufficient data to challenge E&P companies on whether they have the level of insight and control required to deliver and sustain a highly efficient well production system.
Figure 4 shows a simplified view of a typical well factory or well production system, from G&G all the way through to handing the well over to be put on production. The well production system shows the individual operations required to ‘produce’ a well, including well scoping, planning, permitting, pad construction, etc. In addition, it recognizes the ‘inventory’ of knowledge work, materials and executed work which is ‘waiting’ between each operation as identified by the orange triangles. Whatever form this inventory of work takes, too much or too little of it in each orange triangle will result in unproductive capital (cash tied up) and inefficient operations (higher cost and longer duration).
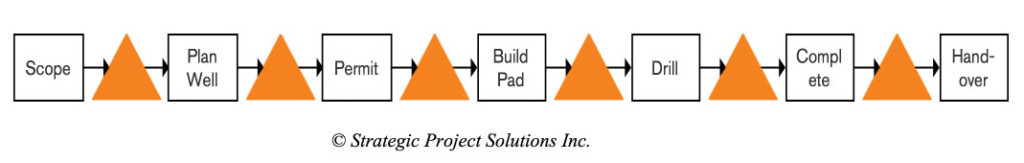
Figure 4: A Simplified Unconventional Well Production System
To free up this unproductive capital, companies must understand their optimal well production system both within and between operations. In our experience, many oil and gas industry executives know the time and cost within an operation (e.g. drilling days and drilling cost/well) but few know what the time and cost is between operations. Even fewer know what the time and cost ‘should be’ for optimum performance. Understanding this is critical to controlling cash tied up and the associated value leakage.
To master the well factory or well production system, operators must move beyond the current approach of locally optimizing each operation in the well production system, treating it like an assembly line on which each operation must be fully utilized, focusing on the isolated performance of each operation (e.g. drilling, completion, flowback). Instead, they should more fully understand and implement a ‘factory’ system that focuses on optimizing performance across the entire well production system.
In a recent project, we identified a $300 to $500 million reduction in cash required to deliver 200 wells over one year simply by optimizing the factory system. This required the counter-intuitive action of reducing the work being executed in the system, despite requests to put more in the front end of the process. The system view itself showed that this merely added cash requirements without increasing the number of wells delivered by the system. Since these dynamics are counter-intuitive for many leaders in oil and gas, understanding them becomes critical for effective decision-making in a well production system.
With up to $10 billion of cash and $65 billion in lost revenue on the table, this implies many operators have at least $1 billion of revenue at stake. When the performance gap and value leakage for these companies is ultimately revealed to investors, as it undoubtedly will be, the simple questions which may define the legacy of executives will be ‘How much value was leaking?’, and ‘What did you do about it?’
This is the new reality. Now that industry executives are aware of the problem they should prepare themselves to address investor concerns on the efficiency of their well production system and any associated value leakage.