Timely and accurate wastewater chemical testing in wastewater treatment plants is essential to confirm compliance with environmental standards and to correct operational problems. In China, trained laboratory analysts manually perform the sampling and testing tasks required by regulations. However, with increasingly stringent environmental regulations and growing complexity in testing protocols, laboratories in these facilities are experiencing capacity constraints. While switching to robotic testing solutions present a promising solution to augment laboratory analysts’ capacity, plant managers face challenges in quantifying its benefits on daily operations to justify the upfront investment.
This technical paper adopts the Operations Science (OS) principles and Project System Optimization (PSO) to analyze the operational impacts of adopting automation for daily laboratory testing tasks in a wastewater treatment plant in China. The results demonstrate that adopting the robotic testing platform for wastewater sampling and testing processes releases testing analysts from manual logistic tasks, while reducing average testing cycle times by 17% for the total nitrogen test, 46% for the total phosphorus test, 60% for the ammonia, and 71% for the chemical oxygen demand test reducing 50% total daily testing duration from approximately 6.5 hours to 3.3 hours. In addition to cycle time improvements, the robotic testing platform reduces process variability and the likelihood of human error. Moreover, the robotic testing platform provides short-term forecasting of effluent quality using IoT-integrated sensors. These results demonstrate that the robotic testing platform not only enhances operational efficiency but also supports more predictive operations management. The OS and PSO-based evaluation approach provides an operations management perspective for plant managers to assess automation adoptions beyond traditional cost-based metrics and for policy makers to consider adjusting regulations to encourage operational innovations in wastewater treatments in China.
Keywords: Process modeling; Discrete event simulation; Wastewater treatment plants; Robotic wastewater sample testing

Bochen is a Ph.D. student in Stanford University major in Sustainable Design and Construction program under Civil and Environmental Engineering department. His research interests are applying operations science principles and process simulation methods for supply chain management of prefabrication/modular constructions. Bochen had industry experience ...

Martin Fischer is a Professor of Civil and Environmental Engineering and (by Courtesy) Computer Science at Stanford University. He is also the Director of the Center for Integrated Facility Engineering, a Senior Fellow of the Precourt Institute for Energy, and the Coordinator of the Building Energy Efficiency Research at the Precourt Energy Efficienc ...
In an ideal situation, efficiently removing the pollutants of human activities from the water bodies has been a growing challenge for wastewater treatment plants (WWTPs) globally [1, 2, 3]. In reality, rapid urbanization, industrialization, and population growth in developing countries, such as China, have intensified water pollution, increasing the burden on WWTPs to deliver reliable, high-quality treatment.
China owns the world’s largest municipal wastewater sector in terms of total number of WWTPs and treatment capacity [1]. These WWTPs rely on complex biological and chemical processes to remove pollutants, such as phosphorus, nitrogen, ammonia, and chemical oxygen demand, from the effluent discharged into the environment [3, 23]. Research has shown that the operation performance, measured in terms of reduced pollutant concentration, often falls short of requirements due to high hydraulic loading rates [3], large fluctuations in influent composition, and limited visibility into internal process conditions [4]. Therefore, timely and accurate monitoring of pollutants in influent and intermediate process stages is critical to improve WWTP operations.
Many WWTPs in China were constructed during the country’s rapid economic expansion from the 1990s to the early 2010s [5]. However, their process designs and operational technologies have not kept pace with recent advancements in sensing, automation, and data-driven process control [1, 3, 6]. Regulatory requirements exacerbate the situation by stipulating that certified laboratory analysts must manually test and validate pollutant measurements for legal and compliance purposes [7]. Furthermore, the investment in adopting new technologies must undergo a lengthy government approval process. In the absence of a systematic way to evaluate the operational impact of adopting new technologies, such as improvements in throughput, cycle time, and resource utilization, plant managers face difficulties in justifying the cost of such investments. As a result, most WWTPs continue to rely on outdated, manual testing workflows that are both labor-intensive and increasingly misaligned with operational performance expectations.
Nevertheless, manual wastewater sampling and testing processes face persistent operational challenges that cannot be solved by simply hiring more analysts. Manual sampling and testing processes are constrained by testing cycle times, process variability, and limited working hours. These constraints and unpredictable events, such as storm surges, lead to long and variable testing cycle times [2]. As a result, manual wastewater testing in most plants can be conducted once per day, typically only at the influent and effluent points. This low-frequency manual testing approach limits visibility into the treatment process steps and hinders the plant’s ability to monitor and adjust operations in response to rapidly changing influent conditions. Additionally, the reliance on manual procedures creates inconsistencies in the quality of testing results, with human errors in pipetting, timing, and data entry affecting result accuracy [2]. Despite regulations that mandate manual testing processes in China [7], as WWPTs seek to improve reliability and meet growing regulatory and operational demands, addressing the limitations in manual laboratory testing workflows becomes increasingly critical.
Recent research has investigated increasing the level of automation in wastewater sampling and testing with technologies such as IoT devices and robotic process control solutions [8]. For instance, Guerra et al. [9] deployed a drone to automate the manual process of collecting wastewater samples, enabling consistent and precise sampling even in hard-to-reach areas. Moreover, using IoT sensors to monitor critical metrics introduces the opportunity to collect high-frequency, near-real-time data to predict treatment cycle time, thereby supporting predictive effluent analysis and enhancing timely treatment process adjustments [10]. As large datasets become available, researchers explored implementing artificial intelligence-based techniques to predict major pollutants in the discharge, such as chemical oxygen demand, to inform aeration demand and accurate chemical dosage in order to minimize energy costs [11]. Many of these advanced technologies have been piloted in WWTPs, primarily in developed countries such as those in Europe [12, 13].
Despite these advances, the full adoption of automation solutions in WWTPs remains limited, largely due to the high upfront cost of deployment and the difficulty of quantifying system-wide operational gains [14]. Current investment decisions are often based on short-term financial metrics, such as labor hour savings, and fail to capture the broader impact of automation on process performance and long-term efficiency. A more comprehensive process analysis method is needed, one that considers not only cost, but also how automation improves throughput, reduces process variability, and supports data-driven decision-making. For example, in the case study, we found reducing variability in process flow reduced more cycle time than simply adding more capacity to the processes. Operational improvements, including cycle time savings, repurposing analysts’ work hours to high-value responsibilities, and enhanced predictability through the collection of treatment process data, may justify upfront automation investments when viewed through a process lens.
This paper explores how OS and PSO can support the implementation of robotic testing platforms to improve operational efficiencies in wastewater treatment plants. In collaboration with a WWTP located in northeastern China, this study evaluated and compared the operational impact of manual and automated wastewater pollutant testing processes. A data-driven, OS and PSO-based process analysis method is proposed to move beyond financial calculations and assess in detail how adopting a robotic testing platform affects the key operational metrics, such as throughput, cycle time, and resource capacity. This approach provides a practical decision-support tool that helps plant managers and policymakers quantitatively assess automation not just as a capital investment but as a long-term strategic intervention for improving the operational efficiency of WWTPs in China.
To evaluate the operational performance of the wastewater testing process, this study applies the principles of OS and PSO to model and simulate the wastewater sampling and testing process as a production system. OS provides a quantitative foundation for analyzing the interrelationships among key operational variables, such as throughput, work-in-process, testing cycle time, resource utilization (e.g., analysts’ work hours), and variability, offering a rigorous method to assess how process design influences system performance [15]. By framing sampling and testing as a production system, OS allows decision-makers to evaluate how the adoption of automation affects the operational efficiency of the testing process.
Building on the OS foundation, this study adopts PSO further to structure the modeling and evaluation of wastewater testing workflows. PSO provides an OS-based methodology for systematically mapping activities, quantifying capacity, simulating process behavior, and identifying bottlenecks in production systems. PSO utilizes both Analytical Modeling and the Discrete Event Simulation (DES) method to analyze and optimize the production system considering the variability [16]. PSO allows practitioners to assess how system performance is affected by resource constraints, process variability, and process design decisions by generating realistic schedules for various scenarios.
Recent studies have demonstrated the effectiveness of PSO in improving flow and reducing variability in production process design contexts in civil engineering projects [17, 18]. For example, Zhang et al. [19] applied PSO to a modular bathroom production system, identifying a 50% increase in throughput and a reduction in lead time error from 44% to 4% through analytical modeling and DES. However, despite these promising applications, the use of PSO in infrastructure operations processes, particularly laboratory testing processes in WWTPs, remains limited. The wastewater testing process exhibits similar characteristics of a production system: wastewater test samples flow through a sequence of tasks constrained by analysts’ capacity, testing cycle times, and process variability. This makes PSO a compelling method for analyzing and optimizing laboratory testing processes in WWTPs.
In this context, this study applies OS and PSO, supported by analytical modeling and DES, to compare the performance of manual versus robotic wastewater testing workflows. The analytical process model captures real-world variability in sample inflow, analyst availability, and processing times under both current and automated configurations. By simulating multiple scenarios of both manual and automated testing processes, we identify the operational benefits of automation, including reductions in testing cycle time, reduced labor resource utilization in manual logistics work, and improved process stability. This approach enables a more informed, data-driven decision-making process, moving beyond static financial calculations to holistically evaluate automation from the perspective of improving operations efficiencies and augmenting monitoring capabilities in WWTPs in China.
This research employed a case study approach [20] to explore the implementation of OS principles and the PSO framework, comparing and analyzing wastewater sampling and testing processes before and after the adoption of a robotic testing platform in a WWTP located in China. Testing data was primarily collected through interviews with the plant managers and laboratory analysts. Additional manual process data was mainly collected from the historical testing documentation. Production Optimizer, a proprietary software designed for PSO by Strategic Project Solutions, Inc., supports OS-based analytical modeling and DES of the target processes. Testing cycle times, work hour utilization of laboratory analysts, and average testing lead time are used to describe the operational performance of both manual and robotic wastewater testing processes.
The first task involved mapping and collecting process parameters for both the existing manual processes and the robotic testing process. Manual process steps and average testing task durations were validated using plant documentation and reviewed with the management team of the studied WWTP. For the robotic system, the standard workflow and task durations were provided by the technology vendor. Process variability was estimated using squared coefficients of variation (SCV) based on typical industry assumptions: SCV = 1.0 for manual processes and SCV = 0.1 for automated tasks due to the limited availability of empirical variability data [21]
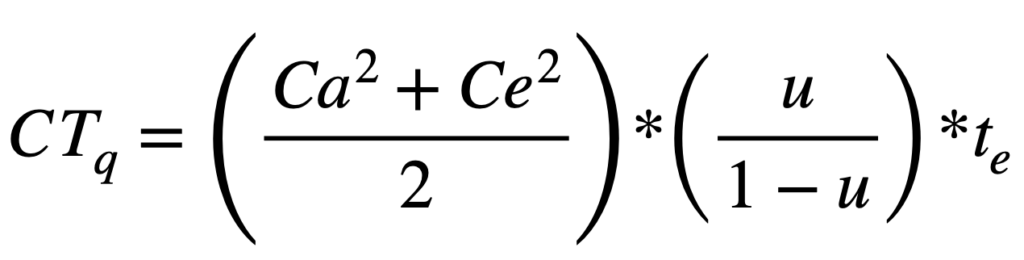
The second task involved applying OS-based analytical modeling using Production Optimizer, a proprietary tool developed for implementing PSO. The analytical model quantified production metrics, such as average testing cycle time and analyst capacity utilization. Little’s Law and the VUT equation (which accounts for the effects of variability, utilization, and processing time) were applied to estimate average cycle times under different operational conditions. For instance, the analyst capacity utilization was defined as the percentage of an analyst’s available work time (e.g., 8 hours per day) spent on testing activities. In both scenarios, the skilled analysts either perform manual tasks directly or supervise robotic operations. Therefore, analysts’ work hours were tracked through utilization rates in both models. These calculations allowed for comparison between the manual and the automated workflows, accounting for both average cycle time, work hour utilizations and the impact of variability on testing processes.
The third task involved conducting DES to estimate wastewater sampling and testing lead times under dynamic conditions. DES generates schedules for both manual and robotic testing processes, assuming dedicated laboratory analysts with no cross-allocation to other tasks and no rework. Due to insufficient historical data to establish empirical probability distributions, task durations were assumed to follow a normal distribution. No sensitivity analysis was conducted to evaluate the implications of alternative distributions, which is a limitation of the study. Simulation results were validated with the recorded testing time shared during review sessions with the plant management team and information from the robotic testing platform provider to align with real-world situations. This collaborative validation helped to interpret the practical implications of the findings.
This study applies core equations from OS to model and evaluate the capacity and behavior of the wastewater testing workflows:

This study was conducted in partnership with a WWTP located in northeastern China to evaluate and compare the operational impacts of manual versus robotic wastewater testing processes. The plant, commissioned in 2011, is a critical component of the region’s municipal wastewater infrastructure, serving approximately 85,000 residents in a city near the Songhua River. Designed with the anaerobic-anoxic-oxic (A2/O) process, the plant can treat up to 38,000 cubic meters of wastewater daily, with an inflow capacity of 100,000 cubic meters per day [22]. In response to tightening discharge standards, the WWTP management team initiated efforts to improve the testing frequency, result accuracy, and predictive capability of pollutant monitoring. The objective is to generate high-quality, near-real-time data to support more effective process control and timely operational adjustments. Figure 1 illustrates the current treatment process and the sampling points at the plant’s influent and effluent.
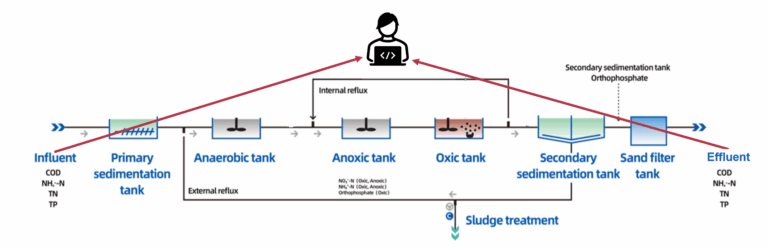
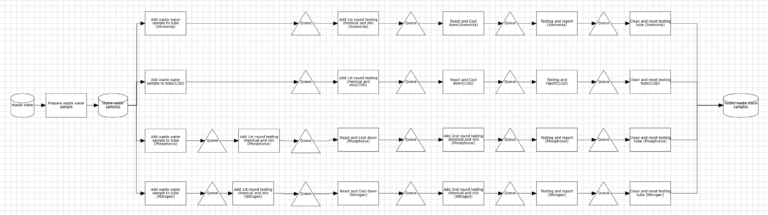
The plant routinely monitors concentrations of key pollutants, including total phosphorus (TP), total nitrogen (TN), ammonia, and chemical oxygen demand (COD), through manual sampling and laboratory testing. Samples are typically collected once each morning by one or two assigned laboratory analysts. Each analyst collects wastewater samples from the influent and effluent channels, fills testing tubes, and conducts parallel batch tests, using four sample tubes per batch for result reliability. If only one analyst is present, tests for TP and TN are prioritized, while tests for ammonia and COD are initiated during reaction and cooldown periods. With two analysts, all tests can be executed simultaneously. Figure 2 presents the detailed steps in the manual testing workflow.
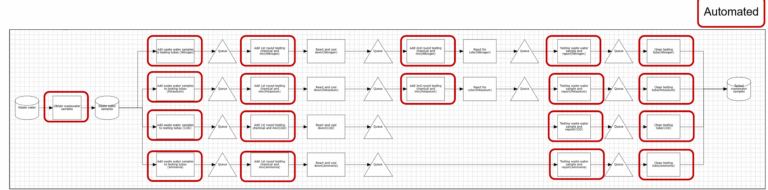
The robotic testing platform introduced at the plant automates testing operations, such as precise dosing of wastewater samples and chemicals, using robotic arms. It further integrates an optical spectrometer to analyze the chemical composition of the samples and generate testing reports automatically using a standardized digital template. Although the robotic process automates most physical tasks, a certified laboratory analyst is still required by regulation to supervise the process. This analyst oversees testing via a central console, intervenes if needed, and verifies results by reviewing and signing off on the final reports. Figure 3 describes the automated treatment process monitoring at multiple process steps.
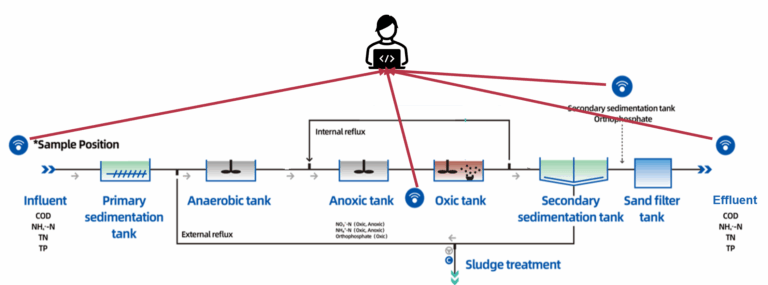
To support this study, operational data were collected through interviews with the WWTP’s management team, analysis of historical testing records, and data exports from the robotic system’s database. While the historical records and interviews provided high-level estimates of average process times, the robotic system offered more granular data with exact timestamps for each step, enabling precise cycle time analysis. However, due to the limited availability of operations data in the pilot project, particularly for the manual process, variability estimates for each testing step were assumed based on standard values in the literature: SCV = 1.0 for manual processes and SCV = 0.1 for automated processes [21]. Task durations were assumed to follow a normal distribution. Figure 4 outlines the automated process map and highlights the steps performed by the robotic testing platform.
At the time of this study, WWTP’s management team was actively evaluating automation solutions to improve process monitoring and enable leaner plant operations. A key decision point involved whether to adopt the robotic testing platform, which would require a substantial upfront capital investment. To support this decision, the management team sought to understand how automation would affect operational performance, specifically, testing throughput, cycle time, and resource allocation. This case study applied the PSO to support data-driven decision-making regarding automation adoption. The analysis was completed within three months and results were presented to WWTP’s management team in a timely manner. The rapid turnaround helped maintain momentum and engagement across the organization. Findings from the study provided valuable insights into the performance implications of robotic testing and served as a practical foundation for assessing the return on investment in automation from an operational efficiency perspective.
Using OS-based analytical modeling, the study calculated the average cycle times for each major pollutant testing process—comparing manual and robotic workflows. The analysis decomposed total cycle time into three components: processing time, queuing time, and chemical reaction time. Table 1 summarizes the results for total average cycle times across four pollutant tests: TP, TN, ammonia, and COD.
Table 1. Average cycle time breakdown for manual and robotic testing processes across major pollutants.
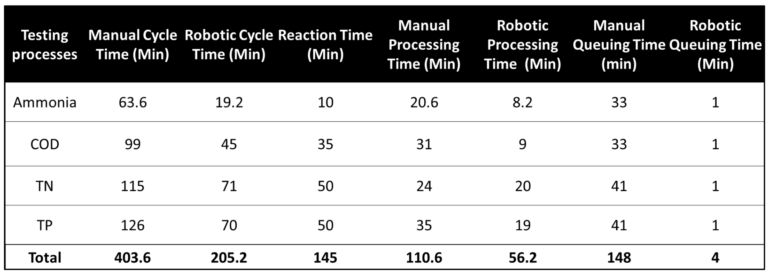
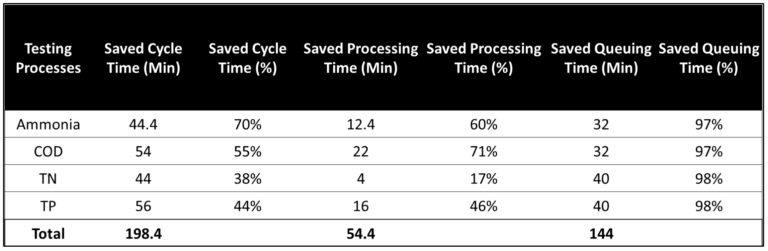
To assess the impact of automation, we further quantified the time savings achieved by adopting the robotic testing platform. Table 2 presents the reduction in total average cycle time, processing time, and queuing time. Across the four tests, automation led to a 44% to 70% reduction in total average cycle time, with absolute time savings ranging from 44 minutes to 56 minutes. The most significant reduction was observed in the COD test, where automation reduced processing time by 22 minutes and queuing time by 32 minutes. The TN test saw the smallest processing time reduction at 4 minutes with a 40-minute reduction in the queuing time. By comparing the processing time saved and queuing time saved, more savings in the cycle time came from eliminating queuing time caused by process variability. Overall, automation reduced queuing time by 144 minutes, compared to 54.4 minutes saved in processing time. This underscores the value of improving process consistency and flow stability in addition to reducing task duration.
Table 2. Cycle time savings through automation: total, processing, and queuing time reductions.
Laboratory analyst work hour utilization is a key metric that ties directly to labor cost and operational efficiency. In the manual workflow, analysts are responsible for a range of labor-intensive tasks, primarily related to logistical handling and sample processing. In contrast, the robotic system automates most of these tasks, allowing analysts to focus on oversight and higher-value responsibilities. The OS-based model calculated an analyst work hour utilization rate of 31% for participating in the manual testing process, compared to only 8% for overseeing the robotic workflow. This represents a significant reduction in direct labor time, which could enable laboratories to reallocate analyst capacity toward higher value tasks, such as data interpretation, anomaly detection, and proactive process control, thus improving the overall efficiency and effectiveness of the studied WWTP.
To validate the analytical findings and assess system-level impacts, the authors used DES to generate the daily testing schedule for multiple scenarios under the impact of variability for both manual and robotic testing processes. Figure 5 illustrates a representative simulation outcome, comparing the task schedules generated for manual (left) and robotic (right) workflows.
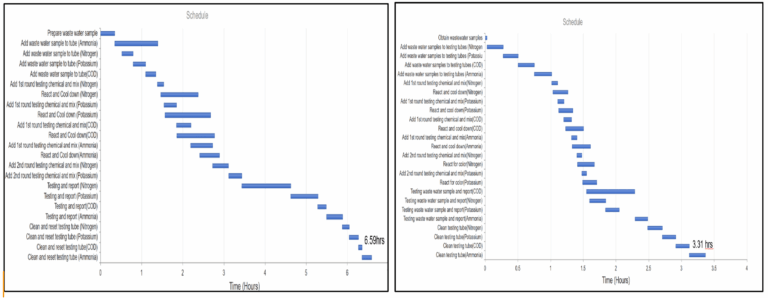
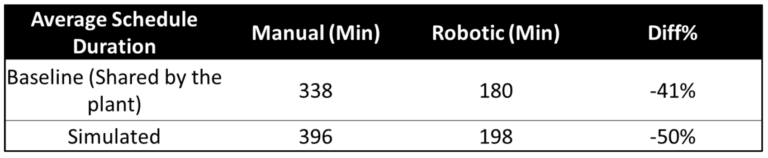
The simulation was run across 50 independent scenarios to capture possible impact of variability. On average, the manual testing process required 396 minutes to complete daily testing, whereas the robotic workflow completed the same tasks in 198 minutes, achieving approximately 50% reduction in daily wastewater testing duration. These results were validated against historical time benchmarks provided by the WWTP, as summarized in Table 3.
Table 3 Comparison of simulated and observed testing durations for manual and robotic processes
Current wastewater treatment plant (WWTP) operations remain constrained by labor-intensive and inefficient manual workflows, particularly in laboratory testing processes. This study demonstrates how the application of OS and the PSO can enhance operational efficiency by guiding the adoption of automation technologies in operating critical infrastructures. In partnership with a WWTP in northeastern China, the research modeled and compared manual to robotic wastewater testing processes on key performance metrics, including cycle time, analyst work hour utilization, and process variability.
Based on the findings of this study, the management team at the partner WWTP made a strategic decision to proceed with the implementation of the robotic testing platform. The combined insights from OS-based analytical modeling and discrete event simulation provided the quantitative evidence necessary to justify the upfront capital investment, demonstrating both immediate improvements in operational efficiency and longer-term benefits in system resilience and regulatory responsiveness. As a result, the plant launched a pilot project focused on redesigning and automating key laboratory workflows, with specific objectives to enhance testing reliability, reduce cycle time variability, and improve responsiveness to pollutant fluctuations. The successful outcomes from the pilot have since been documented and shared with other WWTPs as a reference model for data-driven operational transformation.
The analysis results revealed that adopting a robotic testing platform can reduce average cycle time by 44% to 70% across major pollutant tests. Notably, the largest gains were achieved not just through faster processing, but through the elimination of queuing delays caused by process variability. Furthermore, the study showed a reduction in analyst work hour utilization, from 31% to 8%, by shifting manual logistics tasks to automated systems. This implies that skilled laboratory staff can focus on higher-value responsibilities, such as anomaly detection, data-driven pollutant concentration forecasting, and treatment process control. DES simulation results also demonstrated that daily testing durations could be cut in half by adopting a robotics testing platform.
In addition to improving task efficiency, the robotic testing platform leverages Internet of Things technologies to collect granular process data in near real-time. This data enables closer monitoring of treatment processes and supports short-term forecasting of pollutant concentrations in the effluent. Consequently, the plant operators can anticipate treatment adjustments one to three hours in advance. These digital capabilities of the robotic testing platform represent a move toward more predictive and data-driven management of WWTP operations, enhancing the plant’s ability to monitor pollutants in the wastewater influent and therefore respond to changing regulatory demands.
By integrating OS principles and PSO, this study provides a structured and quantitative approach to evaluating the adoption of automation. This goes beyond traditional financial analysis by capturing the dynamic interactions between operations parameters, offering an operations management perspective for decision-making. The application of PSO to wastewater testing processes illustrates the broader potential of process-based thinking in infrastructure operations. As WWTPs in China and beyond face increasing regulatory and operational pressures, adopting data-driven OS principles can support more efficient operations performance. Future research can build on this work by collecting additional empirical data and conducting sensitivity analyses on both manual and robotic process variability to validate current assumptions. Extending the PSO framework to upstream and downstream operations, such as chemical dosing, could reveal further opportunities for operations efficiency improvements.
Beyond the research perspective, enabling innovation in WWTP operations requires regulatory flexibility and stronger financial support. This includes updating compliance standards to formally recognize certified robotic testing systems under analyst supervision and providing targeted funding or pilot incentives to reduce the upfront financial burden of adopting automation in the operations of WWTPs in China. Aligning regulatory standards with promising innovation will be key to modernizing and improving the operations of the existing WWTPs in the long term.
[1] J.-Y. Lu, X.-M. Wang, H.-Q. Liu, H.-Q. Yu, and W.-W. Li, “Optimizing operation of municipal wastewater treatment plants in China: The remaining barriers and future implications,” Environment International, vol. 129, pp. 273–278, Aug. 2019, doi: 10.1016/j.envint.2019.05.057.
[2] G. Bertanza, R. Boiocchi, and R. Pedrazzani, “Improving the quality of wastewater treatment plant monitoring by adopting proper sampling strategies and data processing criteria,” Science of The Total Environment, vol. 806, p. 150724, Feb. 2022, doi: 10.1016/j.scitotenv.2021.150724.
[3] J. Zhang et al., “Current operation state of wastewater treatment plants in urban China,” Environmental Research, vol. 195, p. 110843, Apr. 2021, doi: 10.1016/j.envres.2021.110843.
[4] Q. V. Ly et al., “Exploring potential machine learning application based on big data for prediction of wastewater quality from different full-scale wastewater treatment plants,” Science of The Total Environment, vol. 832, p. 154930, Aug. 2022, doi: 10.1016/j.scitotenv.2022.154930.
[5] J. Qu et al., “Municipal wastewater treatment in China: Development history and future perspectives,” Front. Environ. Sci. Eng., vol. 13, no. 6, p. 88, Dec. 2019, doi: 10.1007/s11783-019-1172-x.
[6] Q. H. Zhang et al., “Current status of urban wastewater treatment plants in China,” Environment International, vol. 92–93, pp. 11–22, Jul. 2016, doi: 10.1016/j.envint.2016.03.024.
[7] P. Yitong and J. Jing, “Interview with product team of Sequoia Libra Technology,” Mar. 28, 2025.
[8] S. Cairone et al., “Revolutionizing wastewater treatment toward circular economy and carbon neutrality goals: Pioneering sustainable and efficient solutions for automation and advanced process control with smart and cutting-edge technologies,” Journal of Water Process Engineering, vol. 63, p. 105486, Jun. 2024, doi: 10.1016/j.jwpe.2024.105486.
[9] E. Guerra, Y. Bolea, A. Grau, R. Munguia, and J. Gamiz, “A solution for robotized sampling in wastewater plants,” in IECON 2016 - 42nd Annual Conference of the IEEE Industrial Electronics Society, Florence, Italy: IEEE, Oct. 2016, pp. 6853–6858. doi: 10.1109/IECON.2016.7793683.
[10] A. W. Alattabi, C. Harris, R. Alkhaddar, A. Alzeyadi, and M. Abdulredha, “Online Monitoring of a Sequencing Batch Reactor Treating Domestic Wastewater,” Procedia Engineering, vol. 196, pp. 800–807, 2017, doi: 10.1016/j.proeng.2017.08.010.
[11] E. Aghdam, S. R. Mohandes, P. Manu, C. Cheung, A. Yunusa-Kaltungo, and T. Zayed, “Predicting quality parameters of wastewater treatment plants using artificial intelligence techniques,” Journal of Cleaner Production, vol. 405, p. 137019, Jun. 2023, doi: 10.1016/j.jclepro.2023.137019.
[12] G. Olsson, “Automation Development in Water and Wastewater Systems,” Environmental Engineering Research, vol. 12, no. 5, pp. 197–200, Dec. 2007, doi: 10.4491/eer.2007.12.5.197.
[13] V. Nourani, G. Elkiran, and S. I. Abba, “Wastewater treatment plant performance analysis using artificial intelligence – an ensemble approach,” Water Science and Technology, vol. 78, no. 10, pp. 2064–2076, Dec. 2018, doi: 10.2166/wst.2018.477.
[14] M. Tahoor, S. H. Pooja, and L. Saya, “Automated Water Control System in Wastewater Treatment Plants,” in Application of Artificial Intelligence in Wastewater Treatment, Cham: Springer Nature Switzerland, 2024, pp. 155–174. doi: 10.1007/978-3-031-69433-2_6.
[15] W. J. Hopp and M. L. Spearman, Factory Physics, 3rd Edition. Waveland Press, Inc., 2008.
[16] “Glossary - Project Production Institute,” Project Production Institute. Accessed May, 2025
[17] G. Bryan, S. Mitra, S. Gaponenko, and C. Carlson, “Benefits of Modeling and Optimizing Production Systems – An Application on Civil Infrastructure Projects,” in Proceedings of 1st PPI Annual Technical Conference, Project Production Institute, Jul. 2023. Accessed: May 24, 2025. [Online]. Available: https://projectproduction.org/technical-conference/ppm-application-for-infrastructure/
[18] G. Prado and I. D. Tommelein, “Application of Operations Science to Design a Project Production System: A Case Study in Building Construction,” in Project Production Institute Technical Conference Proceedings 2023, 2023. Accessed: Jan. 15, 2025. [Online]. Available: https://projectproduction.org/journal/application-of-operations-science-to-design-a-project-production-system-a-case-study-in-building-construction/
[19] B. Zhang and M. Fischer, “Match Supply with Demand: A Case Study Implementing Production System Optimization (PSO) for Offsite Construction,” in 2024 Technical Conference Proceedings, Jul. 2024. Accessed: Dec. 10, 2024. [Online]. Available: https://projectproduction.org/technical-conference/match-supply-with-demand-a-case-study-implementing-production-system-optimization-pso-for-offsite-construction/
[20] K. M. Eisenhardt, “Building Theories from Case Study Research,” The Academy of Management Review, vol. 14, no. 4, p. 532, Oct. 1989, doi: 10.2307/258557.
[21] E. S. Pound, J. H. Bell, and M. L. Spearman, Factory physics for managers: how leaders improve performance in a post-lean six sigma world. in McGraw-Hill’s AccessEngineering. New York, N.Y: McGraw-Hill Education, 2014.
[22] Asian Development Bank, “People’s Republic of China: Songhua River Basin Pollution Control and Management Project,” ENVIRONMENTAL MONITORING REPORT, Sep. 2011.
[23] A. Xu et al., “Towards the new era of wastewater treatment of China: Development history, current status, and future directions,” Water Cycle, vol. 1, pp. 80–87, 2020, doi: 10.1016/j.watcyc.2020.06.004.