Current project management practice focuses primarily on what to build (scope), when to build (dates) and who will do the work. Schedules depicting what work needs to be done by whom, and when it needs to be done, establish overall expectations (what should / want to happen) and are used as the basis for reporting and forecasting of project progress using baselines. Ignoring the other elements of the equation, the processes and the capacity of the labor, equipment and space that will do the work, i.e., the project production system, results in the inability to effectively predict and control project outcomes as this defines how the work will be done.
Understanding that there is a production system and that it will dictate project behavior including cost, quality, duration and use of cash, along with using Operations Science to understand and control its behavior, is key to delivering projects in accordance with desired outcomes. However, not all projects take this into account, which results in less-than-optimal performance.
The purpose of this paper is to define what a project production system is (and is not) and how it compares and contrasts with schedules, while introducing a framework for effective management of project production systems.
Keywords: Project Production System, Operations Science, Schedules

Todd is the author of Built to Fail: Why Construction Projects Take So Long, Cost Too Much, And How to Fix It, published by Forbes Books in 2024. He is also Founder and President of Strategic Project Solutions, Inc (SPS)., as well as founder of the Project Production Institute. Zabelle has more than thirty years of experience in the delivery of compl ...

Roberto Arbulu is Senior Vice President of Technical Services for Strategic Project Solutions. He has more than twenty years of experience in the delivery and optimization of energy, industrial, technology, and infrastructure capital projects and has worked with numerous owner operators and service providers across North America, South America, Europ ...
The notion of a project as a form of production was set forth by Schmenner1 shortly thereafter becoming a formational principle of the Lean Construction movement. The concept is based on the idea that if a construction project can be understood to be a production system, it can be managed and optimized as such. Lauri Koskela2 of Stanford University proposed that much of what companies such as Toyota do in their manufacturing operations could be translated and effectively applied to improve project outcomes, while also acknowledging that construction is not manufacturing. Shortly thereafter, the founding of the International Group for Lean Construction (IGLC) and the establishment of the Lean Construction Institute (LCI) in 1997, provided the basis for research, development and advocation of project production thinking as an element of project management.
Though early Lean Construction Institute papers2. clearly focused on the production aspects of project delivery, this never penetrated or changed the construction industry’s intense focus on scheduling. Though there remains a fair amount of discussion about the project production system framework, the concept is not yet well understood nor applied. Numerous consultants packing 3M Post-it® Notes, software companies (some now armed with AI/ML) and academic researchers focus on how to model and control what they believe to be project production systems, but in reality, are just updated attempts to create a project schedule. As are the so-called kanban boards and software, which are being used in an attempt to depict “project production systems.” Even the Last Planner® System of Production Control has evolved into a scheduling tool.
Emerging technologies now look to apply artificial intelligence to improve schedule quality and more effectively predict project outcomes. These solutions leverage AI and computing power to create numerous schedule scenarios to find the optimal schedule based on the given situation for a specific project. The latest thinking looks to integrate drones outfitted with photogrammetry enabled by AI/ML to automate progress reporting by sending data back to the project schedule.
There is no doubt that these solutions will bring excitement and hope to those attempting to predict project outcomes using schedules. However, refining how the schedule demand is generated without regard to the actual design of the production system means these efforts will be built on a faulty foundation. Basically, making it easier to do the wrong thing, while reality will always supplant the crystal ball.
It is important to understand that regardless of how schedules are created i.e., engaging a cross-representational team of stakeholders using a backward pass or start-with-the-end-in-mind process, the output of these efforts are only schedules (what should happen) and not a representation of what will happen.
As simple as the concept may be, construction professionals struggle to break through current paradigms that focus on creating and managing project schedules, while remaining completely blind to the actual production system element of a project. The illusion that schedules represent what will occur has inundated the global engineering and construction industry to the point that all contracts require them; however, re-baseline efforts are the norm, not the exception. Attempts to make schedules better only make the plan better but does not make project outcomes better. In its formational documents, LCI recognized this issue by stating the following:
“The Lean Construction Institute (LCI) is a research organization with a very particular focus on production management, the way work is done, in construction. We are very different from other organizations because our first goal is to understand the underlying “physics” of production. This means we want to understand the effects of dependence and variation along supply and assembly chains. These physical issues are ignored in current practice and have no particular relationship to teamwork, communication or contract. These human issues are at the top of practitioner’s lists of concerns because they do not, indeed cannot see the source of their problems in physical production terms.”
Not understanding that ALL projects have one or more production systems, and that the production system(s) is different than a project schedule, results in project professionals attempting to use conventional scheduling methods to map, model, and in some form, control what they believe to be project production systems.
So, let’s explore what exactly is a project production system, how it is different from a schedule, the relationship between schedules and production systems, and more importantly, why you should care.
It is clear and unquestionable that the global engineering and construction industry, including all organizations involved from owners to contractors to suppliers, has a significant affinity to and rely heavily on schedules that are produced in a variety of formats and using numerous software systems (including worksheets), and that also are a contractual requirement in pretty much every project executed today. In their most popular representation, today’s project schedules are modern versions of Henry Gantt’s3 graphical bar charts used as part of the early 1900’s Scientific Management4 movement in manufacturing, which principles and tools were later introduced to the construction industry by Daniel Hauer5.
Throughout the years, the evolution of how schedules are used have included contributions by the U.S. Department of Defense (DoD)6 in their desire to look for predictability of cost and project durations, not to mention those made by Kelly and Walker7, 8 when they introduced the concept of a critical path, which was later further developed by Fondahl9.
Conventional project management practices and standards assume project teams develop schedules as the way to visualize the start and end of a project through engineering, procurement, construction, and commissioning, and in so doing, establish a baseline for progress control through earned value analysis. A whole body of knowledge exits for how to develop conventional schedules including analysis and optimization techniques. The desire to achieve predicable outcomes has spawned numerous statistical approaches to scheduling such as Monte Carlo Simulations and P50 / P90 analysis. However, what drives the variation in activity durations are embedded in the duration itself rather than expressed as a component that drives these variations.
Nowadays, project schedules are also the basis for project accounting including reporting and forecasting of project progress (project controls). It is therefore a rare event to witness the delivery of a capital project, small or large, simple or complex, critical or non-critical, without the use of some type of schedule. However, the way the industry operates (heavily schedule centric) should not become the reason for confusion leading to the belief that schedules are representations of project production systems. Not only is this belief flawed, but unfortunately, it is this same schedule-centric mentality with a foundation in accounting that blinds practitioners to the existence of project production systems and their impact on project performance.
The implications of this are not trivial.
Projects rely on schedules, risk analysis and progress calculations based on earned value to predict outcomes and attempt to take corrective action if the project is off track. When the progress curve trends off plan, the typical reaction is to re-baseline the schedule and add more resources. If this worked, a much higher percentage of projects would hit their cost and schedule targets. However, by any measure, the data clearly indicates otherwise as demonstrated in the following studies McKinsey conducted with almost a ten-year difference.

In reality, and contrary to strong common beliefs, schedules do not depict how the work is done. Attempts to develop more detailed schedules (e.g., Level 5 or higher) creates the illusion that the how is being established, when in reality, it is in the project production system where the work is done, while often, the project production system is not able to meet the demand imposed by the schedule. Refining and re-baselining the schedule changes nothing other than the demand on the production system. As counterintuitive as it sounds, even adding more resources may be the opposite of what needs to be done.
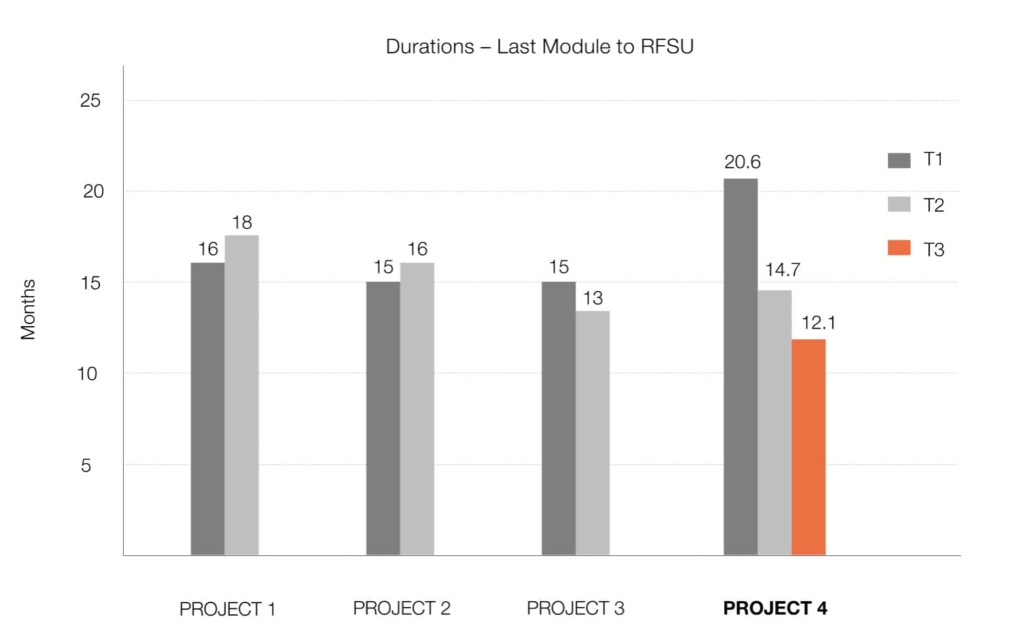
One recent liquefied natural gas (LNG) project clearly demonstrated this issue. Labeled as Project 4 here, its LNG Train 1 was completed under conventional scheduling and progress methods. It fell behind schedule so was re-baselined and significant resources were added. When completed, it benchmarked poorly as seen in the figure below. LNG Train 2, however, was done differently by managing the production system and its inherent complexity and dynamics. As the number of craft resources were reduced, the rate of work completed increased. LNG Train 2 delivered industry average cycle time performance – a significant improvement compared to LNG Train 1. But then, the same methods were carried into LNG Train 3 including production process standardization, which set a world-class benchmark for LNG train cycle time from last module to RFSU. More got done on both Trains 2 and 3 with fewer resources than on Train 1 using conventional methods.
Given this situation, the intent of this paper is not to redefine conventional scheduling practices, but rather propose that well-developed schedules are necessary and represent the long-range demand for project production systems, but are not, however, themselves representations of project production systems.
Production systems are all around us. Preparing food in a restaurant, building homes, making clothing, assembling automobiles, making parts or goods you can find at a hardware store, are all examples of production systems. At the most fundamental level, production systems take inputs (information, materials, energy, etc.) and use various resources to create outputs.
To elaborate further, a production system is defined as a specific set of operations and associated resources within a larger supply network or value chain that produces a technical or physical output to satisfy an external demand11. An operation is an act that utilizes one or more resources to transform one or more attributes of an entity or set of entities into some good or service that is being required to satisfy an external demand12. Resources include labor, equipment and use of space, inventory such as work-in-process and stocks, and time.
The Project Production Institute (PPI) defines a project production system as “the collection of production systems comprising the interconnected network of processes and operations along with the associated resources that represent all the work activities to execute a project from start to finish”13.
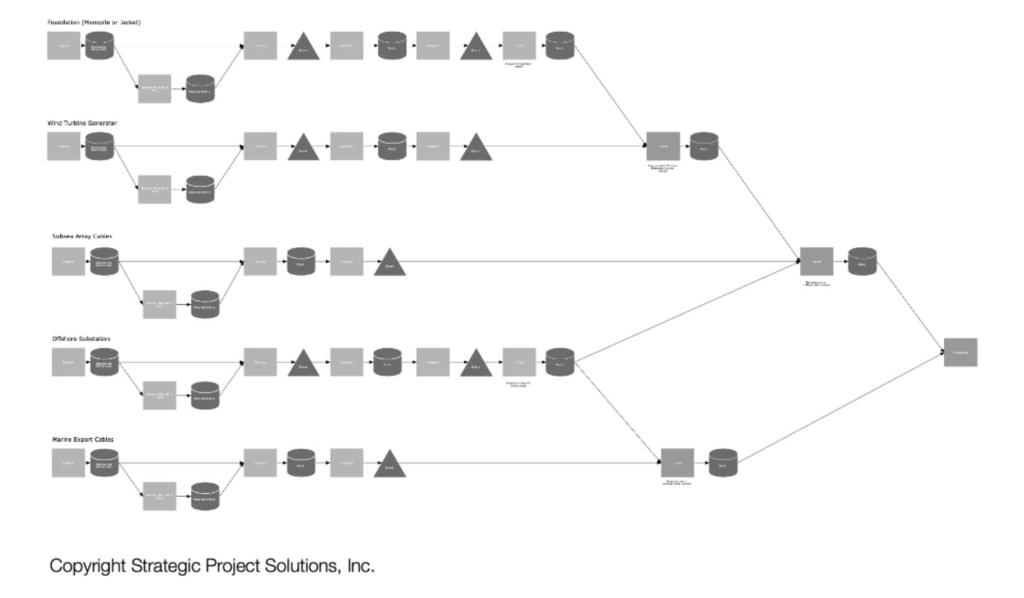
Project production systems focus not only on the actual transformation of inputs into outputs, but also consider multiple operations such as engineering, procurement, inspection, permitting, fabrication and construction, the use of inventories such as documents, materials and work in process, and the generation of queues or anything standing in line waiting to be worked on, waiting to be transported, etc. These are all are represented graphically using process flow diagrams to clearly see the operations / process centers, routings and accumulation of inventory whether work-in-process or stocks.
A key characteristic of a production system is that work flows through it, meaning the items being transformed are either being worked on, transferred to the next operation or waiting to be worked on. In other industries such as manufacturing, it is easier to visualize something being worked on as it flows down an assembly line. However, in construction, the work is known as fixed-position assembly, meaning that the workers move down the assembly line instead.
Let’s illustrate with a simple example of building a foundation. The typical sequence of work is excavate, form, place and tie rebar, place anchor bolts, pour concrete, strip forms, finish concrete, and then, backfill. Clearly the foundation is not moving, but succussive waves of different crafts are doing their work in sequence and then moving on to the next foundation. In the process, the foundation is being transformed or made from rebar, cement, sand, water, and bolts with craft using construction equipment into the finished product. This process is then repeated, over and over again, one foundation after another.
In essence, the items being transformed move through the process / production system and are modeled as such as depicted in a typical flow diagram below, where boxes represent operations that undertake the transformation, triangles that depict queues and cylinders that depicts stocks.
Well-developed schedules are necessary and represent the long-range demand for project production systems, but are not, however, representations of project production systems. In simple terms, schedules are what should happen and concerned with dates, while project production systems dictate what will actually happen and concerned with throughput rates and their relationship to other key production parameters, such as cycle time and its components, work-in-process, capacity utilization, beneficial and detrimental variability, to name few.
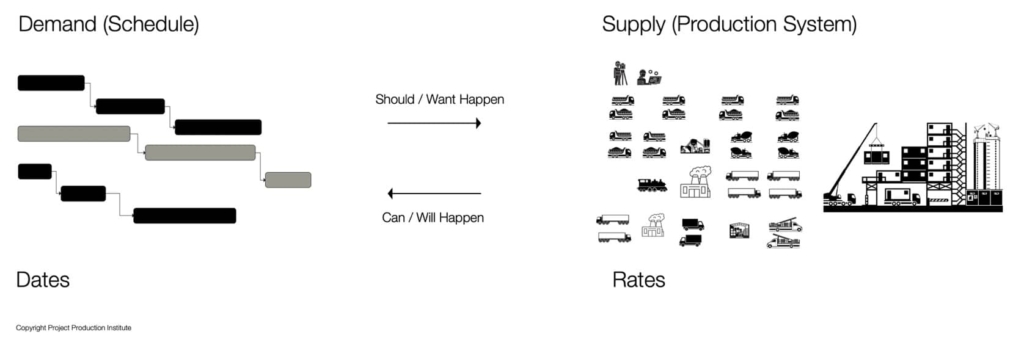
Schedules represent the demand that triggers one or many elements of a project production system. And must be understood for what it is: 1) a forecast of what may happen, and 2) a notice to be ready. Specifically, schedules are needed to forecast when long lead items will be required onsite, provide the basis for forecasting cash outlay or revenue inbound and allow contractors and suppliers to understand what the implications are for their capacity.
Projects cannot be successfully managed on the left side of the equation in Figure 4 using schedules, since what happens is done on the right side by the production system. We see this disconnect all the time and is an extremely important concept to grasp.
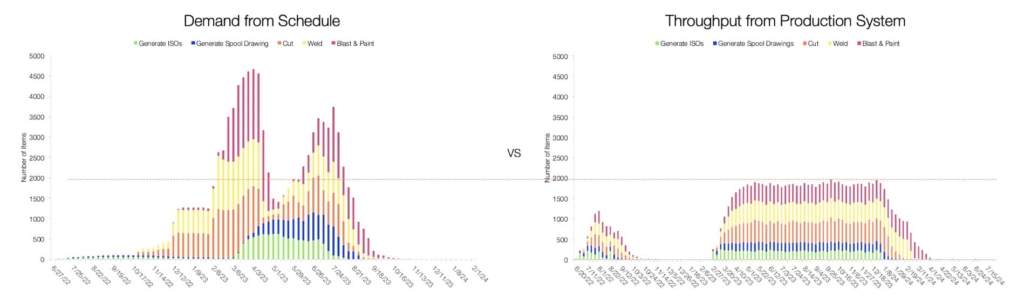
In the following examples, the plan to produce piping (number of items as required by the schedule) and the reality (number of items the project production system is able to produce) are not aligned. In the first example shown on the left, the schedule for pipe spool design and fabrication requires far more throughput than the production system can deliver, as shown on the right. Since the production system cannot satisfy the schedule demand, the schedule duration will increase making this portion, and perhaps the entire project, late.
In the next example, the left graph shows that the current plan accounts for more welders than what is needed by the production system to deliver the demand. On the contrary, the right graph shows that the current plan accounts for less riggers than what the production system needs to meet schedule demand. In both cases, the resources required by the schedule are not adequate in the production system. The question then becomes: are there too few riggers and too many welders or is the schedule’s resource histogram inaccurate (plan lines in the charts below)?
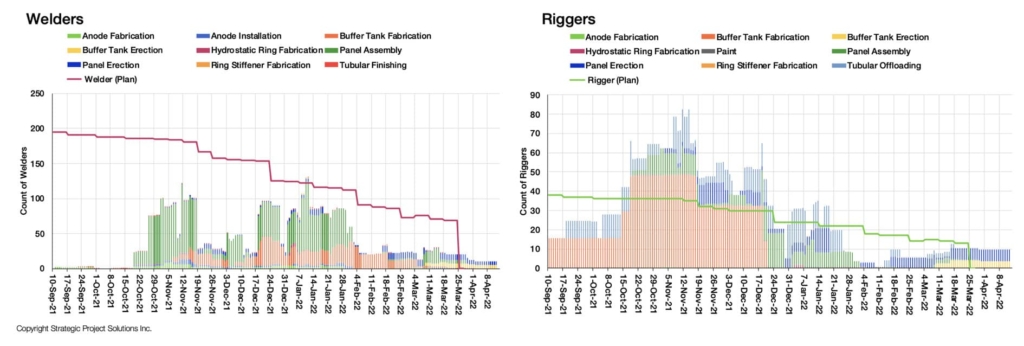
In either case, though the responding production system tries to meet the desired demand within its constraints, such as limited capacity, it really does not matter how aggressive or robust the schedule is, if the project production system does not have the capacity to deliver the demand, the true capacity of the production system will drive the reality of the situation. Since the true capacity of the system is not simply determined by the number of resources, but also depends on the variability of the work, this relationship is not readily understood by the global construction industry.
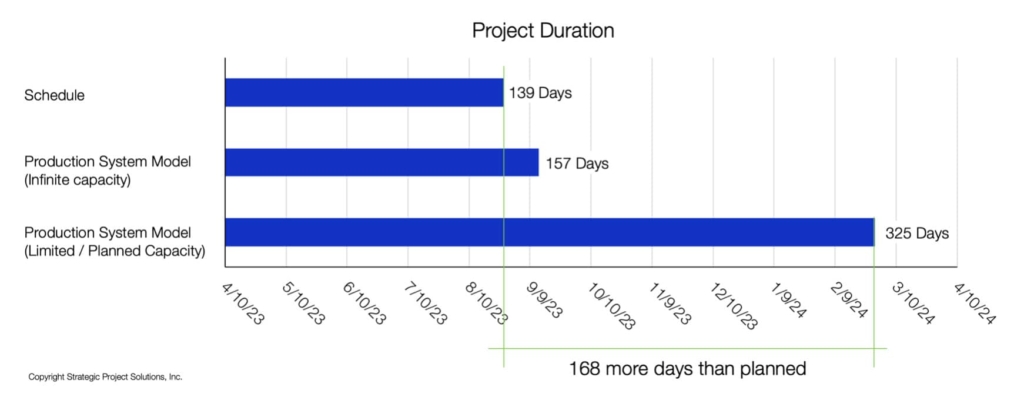
In the next example that analyzes the hook-up and commissioning for an offshore project, we can see the delta between what the schedule states and the ability of the production system to deliver based on the schedule. Unfortunately, for this owner, they stood by their schedule, ignored the reality of the production system’s capacity, and ultimately paid the price in lost revenue, profit and cashflow.
Understanding and influencing how production systems behave is done through the application of Operations Science (OS). OS is the science of almost everything we do14. Thus, as previously mentioned, almost anything people do is an operation. It could be production like manufacturing or the drilling of an oil well or a service like a restaurant or healthcare, or development of engineering. All of these require some resources to provide the product or service. The resources required to perform the transformation include raw materials, components, labor, machines, information, energy, etc. The demand can be from an external customer or an internal “customer” such as a downstream process. A construction project is no different, resources are transformed into a final product or asset.
A key insight of OS is that, due to variability, the demand is never perfectly synchronized with the transformation. Either demand occurs before the transformation or the other way around. Consequently, there must always be some sort of buffer to provide a “clutch” between demand and transformation. And OS teaches that there are only three such buffers: time, inventory, and capacity.
If the demand occurs before the transformation (as in the case of all service operations), then there will be a time buffer, and demand will wait, e.g., ordering food in a restaurant. You wouldn’t want to eat food prepared far in advance of you ordering it. If transformation occurs first, it creates inventory that waits for future demand, e.g., parts available in the hardware store. It turns out that these two buffers are mirrors of each other. If the inventory buffer goes up, the time buffer goes down and vice versa. Consequently, we refer to these two buffers as a single time-inventory buffer. OS also teaches that the time and inventory buffers can both be reduced by reducing the variability in the system.
The capacity buffer is fundamentally different. Production cannot exceed capacity and with OS we can see that it also cannot equal capacity because of variability. When variability exists, there must be a capacity buffer. Moreover, the greater the capacity buffer, the less the need for the time-inventory buffer. So, the time and inventory buffers can be reduced by either reducing variability, adding capacity or a combination of both. Keep in mind that capacity and resources are not synonymous, as we can increase system capacity without increasing resources by, for instance, reducing variability.
There is one more relationship that is essential to Operations Science and that is the relationship between the three buffers. It turns out that in many cases, the product of the time-inventory and capacity buffers is nearly constant. Moreover, that constant is related to the total variability of the system. The following graphs clearly depict these relationships.
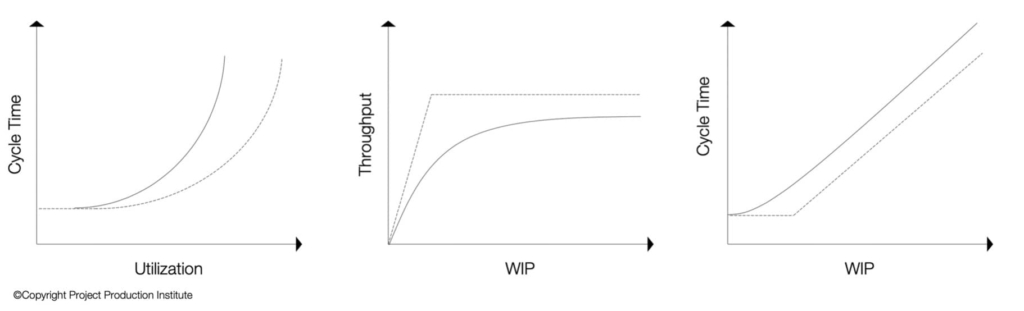
Using these OS relationships, we can efficiently and effectively model, simulate and analyze project production systems resulting in quick and accurate determinations of project outcomes including duration, cost, use of cash, required resources over time and risks throughout the project delivery process. This is a huge breakthrough enabling accurate prediction of project outcomes at any point in time.
The relationship between a schedule and a production system is much like two gears working together: 1) the project schedule provides insight into forecasted demand, and 2) the entire production system (technical as well as craft work) provides insight into actual schedule.
To ensure the production system can meet the demand, the schedule must continue to inform or drive the production system, while at the same time, to meet schedule objectives, the production system must inform the schedule.
If the production system doesn’t have the capacity to respond to the schedule, it will slow down the schedule gear resulting in project delays. If the production system has more capacity than needed for the schedule demand, then it will accelerate the schedule gear exposing opportunities to accelerate (unless we throttle it down purposely by releasing work into the production system slowly than the system is capable of, resulting in lower capacity utilization and shorter cycle time). It is critical to realize that the production gear ALWAYS wins. Sadly, that’s why so many projects underperform despite heroic efforts and focus on the schedule.
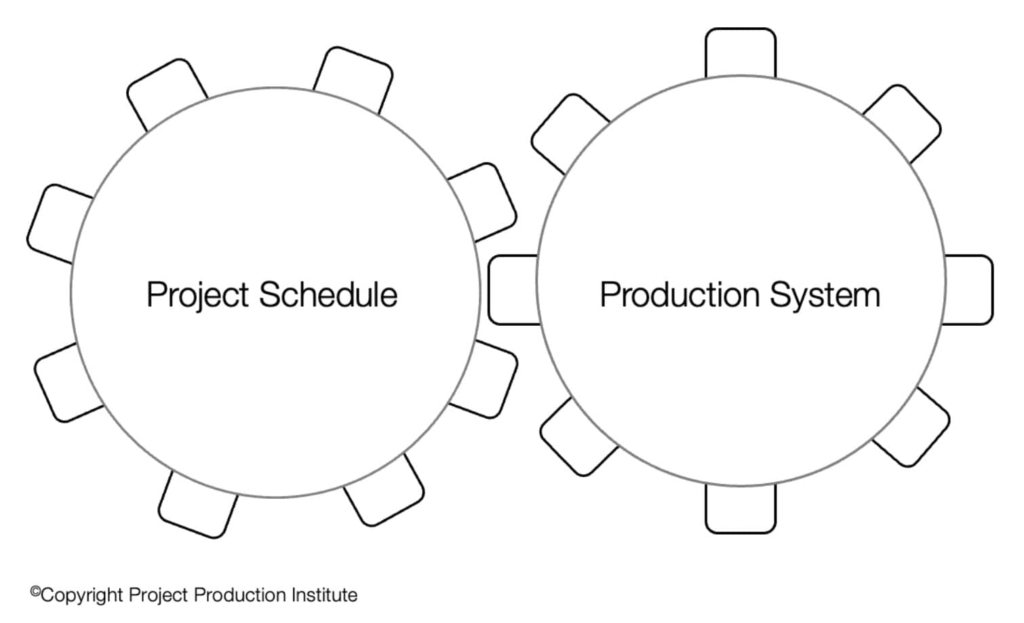
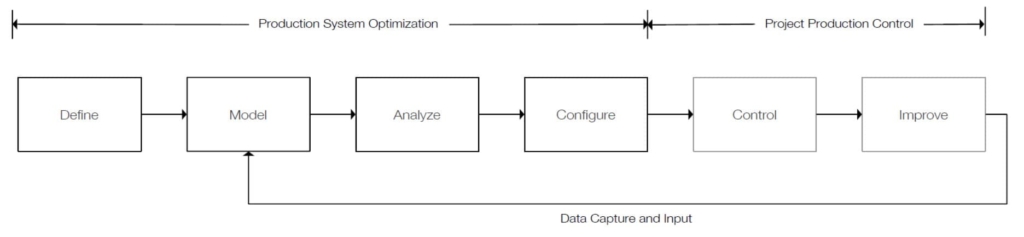
Balance between the two gears can only be realized by mapping, modeling, optimizing and then controlling the project production system as depicted in Figure 9 using Operations Science and Project Production Management methods.
Despite ongoing dialogue amongst project professionals, the concept of a project production system is not well understood. In response, the construction industry has adopted the conventional means of scheduling to map what is believed to be a project production system. The result of this confusion is significant loss of value. By understanding and learning how to manage project production systems, including the application of Operations Science, project professionals can effectively model, control and deliver predictable project outcomes independently of project complexity, size, and level of criticality.
[1] R. Schmenner, “Production/Operations Management”, Macmillan Publishers, 1993
[2] L. Koskela, “Application of the New Production Philosophy to Construction”, Technical Report 72, Center for Integrated Facility Engineering (CIFE), Stanford University, September, 1992
[3] H. L. Gantt, Organizing for Work, New York: Harcourt, Brace and Howe, 1919.
[4] F. W. Taylor, The Principles of Scientific Management, New York, London, Harper & Brothers, 1911.
[5] D. J. Hauer, Modern Management Applied to Construction, First Edition, McGraw-Hill Book Company, 1918
[6] U.S. Department of Defense Instruction DOD1 7000.2, Performance Measurement for Selected Acquisitions, 1967.
[7] J. E. Kelley and M. R. Walker, "Critical-path scheduling and planning," in IRE-AIEE-ACM '59 (Eastern) Papers presented at the December 1-3, 1959, eastern joint IRE-AIEE-ACM computer conference, Boston MA, USA, 1959.
[8] J. E. Kelley, "Critical-Path Planning and Scheduling: Mathematical Basis," Operations Research, no. May-June, pp. 296-320, 1961.
[9] J.W. Fondahl, “Methods for Extending the Range of Non-Computer Critical Path Applications”, Technical Report 47, The Construction Institute (CI), Stanford University, 1964
[11] Glossary, Project Production Institute, (2023), source: https://projectproduction.org/glossary/production-system/
[12] Glossary, Project Production Institute, (2023), source: https://projectproduction.org/glossary/operation/
[13] Glossary, Project Production Institute, (2023), source: https://projectproduction.org/glossary/project-production-system/
[14] Spearman, M.L. and W.J. Hopp (2020) “The Case for a Unified Science of Operations,” Production and Operations Management, 30:3 802-814.