Construction teams in fast-cycle cast-in-place concrete work currently lack access to real-time and automated raw production data, including start and end time, the number and location of labor and equipment as resources, limiting their ability to efficiently and effectively model and control production. Without such data, construction teams are unable to make real-time decisions such as identifying delays and bottlenecks, creating and adjusting the best possible composition of the crews to maximize resource utilization and meet the target completion dates for activities, and efficiently reallocating labor and equipment during dynamic site operations. This research proposes a vision-based model that extracts raw production data (start and end time) from video footage to support real-time, data-driven production system modeling and control in cast-in-place concrete work.
Keywords: Production System Modeling, Construction Operation Detection, Vision-Based Model, Production Data

Zahra is a Ph.D. student in the Department of Civil and Environmental Engineering at Stanford University, where she also earned her Master of Science degree in Civil and Environmental Engineering (MS). Zahra is a PhD student in the Department of Civil and Environmental Engineering at Stanford University, where she also earned her Master of Science d ...

Martin Fischer is a Professor of Civil and Environmental Engineering and (by Courtesy) Computer Science at Stanford University. He is also the Director of the Center for Integrated Facility Engineering, a Senior Fellow of the Precourt Institute for Energy, and the Coordinator of the Building Energy Efficiency Research at the Precourt Energy Efficienc ...

H.J. James Choo, Ph.D is Chief Technical Officer of Strategic Project Solutions, Inc. and a member of the Technical Committee for Project Production Institute (PPI). He has been leading research and development of project production management and its underlying framework of Operations Science knowledge, processes, and systems to support implementat ...
A production system is a coordinated group of operations and related resources that function within a broader supply network or value chain to generate a technical or physical output that meets external demand. An operation involves applying one or more resources to change specific attributes of an entity or group of entities, resulting in a product or service required to fulfill that demand (Project Production Institute, 2023). Production system modeling is the process of mapping and simulating the sequence of construction operations, the flow of inventory (information and materials) and capacity (labor, equipment, and space), and their interactions—so that managers can understand, analyze, and improve the system's performance including effectiveness, efficiency, predictability, reliability, and cost. Project Production Control is any action, process, mechanism, system or combination that organizes and enables control of production, or work execution. In other words, it ensures the right work is getting done by the right labor, equipment, and space per the pre-determined project production objectives (milestones) and policies (work-in-progress).
Granular production data—such as the start and end times of operations, the number and location of resources involved (labor and equipment)—is essential for efficient production system modeling. Without this data, construction teams cannot reliably map the actual behavior of the production system, quantify delays and bottlenecks, adjust and optimize crew composition to maximize resource utilization and meet the target completion dates for operations, and efficiently reallocate labor and equipment. Therefore, granular production data enables construction teams to make informed real-time decisions and maintain effective control over project execution. From an operations science (OS) perspective, granular production data allows teams to calculate actual system capacity versus demand, monitor work-in-process (WIP) levels, quantify variability in productivity and duration, and predict cycle time (Spearman & Hopp, 2020). In summary, without granular production data, it is impossible to rigorously apply OS methods or optimize the production system in practice. Granular production data bridges the gap between theoretical modeling and field execution, enabling systematic control and continuous improvement in fast-cycle cast-in-place concrete work.
However, due to lack of granular production data to gauge performance, conducting an OS analysis is challenging. Traditional and existing data collection methods including paper-based logs, daily reports, and site observation are still widely used to collect production data from construction operations, but they are prone to errors in fast-cycle, dynamic cast-in-place concrete work (Hogan, 2019). Even with more modern tools such as mobile reporting apps, or semi-automated systems like RFID scanners and biometric timekeeping, data collection remains largely manual, intermittent, and reliant on human input (Engineering News-Record, 2013). These methods typically capture data at a coarse temporal resolution (e.g., daily or hourly), often without detailed spatial information about where tasks are performed over time. Moreover, Critical Path Method (CPM) schedules, which guide much of the planning process, are based on static assumptions and are rarely updated with high-frequency field data. As a result, these approaches fall short of providing the continuous, real-time, and fine-grained production data necessary to support real-time production system modeling and enable efficient OS analysis.
To address this gap, this paper proposes a vision-based model that automatically detects construction operations and extracts real-time production data—the start and end times of operations—from video footage. The proposed framework leverages You Only Look Once version 8 (YOLOv8), a state-of-the-art real-time object detection algorithm, to enable detection of construction operations and extraction of production data in real time.
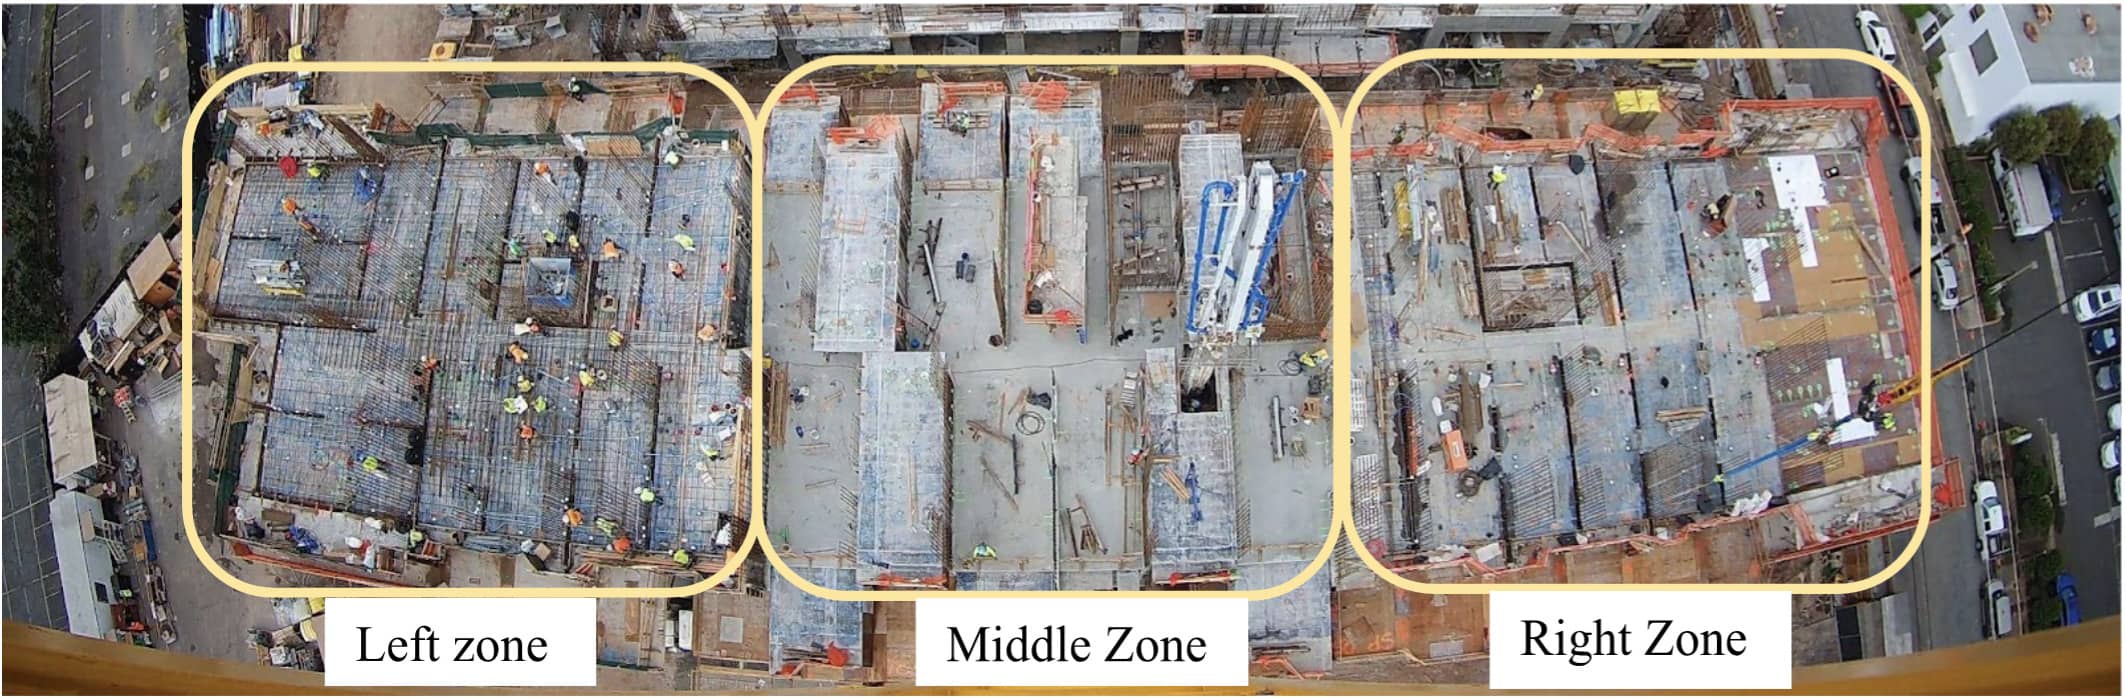
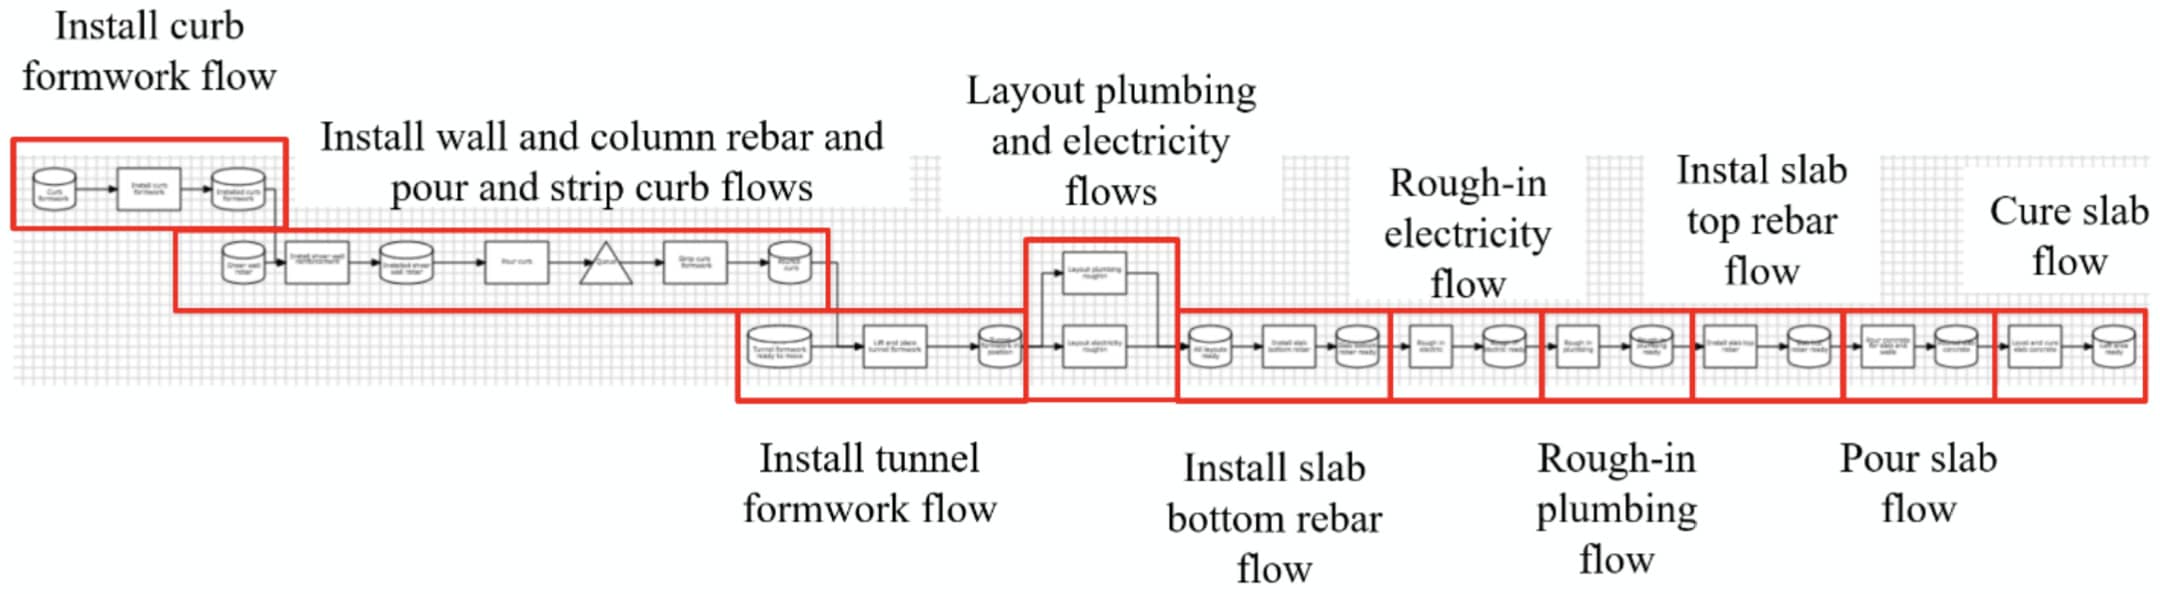
In the summer of 2024, I analyzed the production processes of a 40-story cast-in-place concrete project located in urban Honolulu. The building was divided into three distinct work zones—left, middle, and right—as shown in Figure 1. I observed and documented all operations required to complete one floor in each zone. For each zone, I identified and modeled the flow of operations and their interdependencies as production processes, with each process representing the transformation needed to produce a specific product. An example of the production process map for the left zone is shown in Figure 2.
One day in July 2024, the cast-in-place concrete project was through constructing its 34th floor in the middle zone. The crew began lifting tunnel formwork—a task scheduled from 7:00 AM to 9:00 AM based on the Critical Path Method (CPM) schedule. Due to a minor coordination issue with the tower crane, the task extended to 9:30 AM—a 30-minute delay. Since they used traditional critical path method (CPM) schedules—limited to daily granularity—they could not capture the 30-minute delay. Therefore, without access to real-time as-built data, the delay went unnoticed.
At first glance, a 30-minute delay might seem trivial, but it triggered three poor decision-makings:
This unrecognized 30-minute delay resulted in the project losing an entire workday on Floor 34. While one day might seem manageable, in this fast-cycle project where every floor is completed in five days, such daily slippage accumulates. By the 34th floor, the project faced four full weeks of delay. The float on the critical path disappeared, Labor costs rose, and the equipment rental time grew.
Due to the lack of real-time production data, it was not possible to analyze the production system in real time to identify delays, determine which resources would become bottlenecks, reallocate equipment and crew efficiently, and assess how variability in task durations would affect resource utilization in the real time. As a result, the construction team was unable to create and adjust the optimal crew compositions needed to maximize resource utilization and meet the target completion dates for operations.
This research is intended to answer the following research question:
What is a method to collect real-time production data to create efficient production system modeling as well as project production control in cast-in-place concrete work?
Kinematic-based methods rely on sensors such as accelerometers and gyroscopes to capture equipment or worker movements, offering data on location and as-built start/end times. For example, Kim et al. (2018a) applied inertial measurement units (IMUs) and dynamic time warping (DTW) to recognize mixed excavator activities and accurately measure equipment cycle times, while Rashid and Louis (2019) developed a deep learning framework using LSTM networks and time-series data augmentation to classify equipment operations from IMU signals. Bae et al. (2019) demonstrated the feasibility of using joystick signal patterns to accurately identify excavator tasks such as digging, leveling, and trenching in real time. Yang et al. (2019) tracked steelworker activities using smartphone sensors. However, these methods have limitations, including sensitivity to sensor noise, the need for hardware modifications, and difficulty in distinguishing overlapping or complex operations in dynamic construction environments.
Audio-based methods use sound patterns to detect machine activities. For instance, Sabillon et al. (2017) captured audio with a multichannel microphone array to estimate equipment cycle times. However, high ambient noise levels often impair the reliability of audio-based recognition.
Computer vision–based methods have emerged as scalable, cost-effective alternatives, leveraging widespread surveillance cameras on sites. Cameras are easier to install and maintain than sensors (Xiao and Zhu, 2018; Zhu et al., 2017), and do not require on-body or equipment-mounted devices. Earlier vision-based studies adopted a variety of techniques to recognize construction equipment activities. For instance, Kim et al. (2018) implemented a Tracking-Learning-Detection (TLD) algorithm with spatio-temporal reasoning to identify actions of excavators and dump trucks, but their method lacked integration of equipment interactions, limiting its accuracy in complex operations. Roberts and Golparvar-Fard (2018, 2019) advanced this work by integrating deep learning-based object detection with Hidden Markov Models (HMMs) and Support Vector Machines (SVMs), enabling temporal modeling of activity sequences across long video streams. Chen et al. (2020) proposed a framework using Faster R-CNN, Deep SORT, and 3D ResNet to recognize excavator activities—digging, swinging, and loading. Chen et al. (2023) developed a zero-shot learning framework using CLIP, which enables excavator operation recognition without fine-tuning on construction-specific datasets. Luo et al. (2020) proposed a vision-based framework for improving the recognition of group activities among construction workers in surveillance videos. The proposed method integrates deep activity features extracted using 3D convolutional neural networks (C3D) with contextual information modeled via a Conditional Random Field (CRF). The context includes spatial relevance among workers, modeled through K-nearest neighbor graphs based on tracking-by-detection.
While existing vision-based methods can detect the actions of either equipment or workers individually, they fall short in recognizing full construction operations that emerge from the interactions between workers, equipment, and materials across space and time. In practice, these operations consist of a sequence of such interactions. To address this gap, this paper proposes a vision-based method that recognizes entire operations by modeling the spatio-temporal interactions among workers, equipment, and materials, enabling the extraction of real-time production data (start and end times).
This research focuses on extracting real-time production data (start and end times) from long-term video footage of a cast-in-place concrete construction project to support real-time production system modeling. The case study involves a 40-story cast-in-place concrete project located in urban Honolulu, for which nine months of overhead video footage was available. The building is divided into three operational zones—left, middle, and right—on each floor, as shown in Figure 1. To complete a single floor, a sequence of operations is required, including: installing curb formwork, installing wall and column rebar, pouring and stripping curb formwork, installing tunnel formwork, plumbing and electrical layout, installing slab bottom rebar, rough-in plumbing and electrical systems, installing slab top rebar, pouring the concrete slab, and curing the slab.
This research leverages YOLOv8, a state-of-the-art real-time object detection algorithm known for its high speed, accuracy, and ability to detect multiple object classes simultaneously in complex environments (Yaseen, 2024). The annotated dataset was split into training (70%), validation (20%), and test (10%) sets to ensure robust model training and performance evaluation. The model was trained for 300 epochs, allowing it to effectively learn spatio-temporal patterns and minimize classification errors across all sub-operation classes.
To demonstrate the proposed method, the operation of slab concrete pouring was selected. The goal is to detect this operation in the right zone in real time and automatically extract its start and end times as production data. The overall approach consists of four phases:
Based on the distinct interactions among workers, equipment, and materials, each construction operation was systematically decomposed into a set of sub-operations to enable fine-grained recognition by the computer vision model. In order to detect the whole operation of slab concrete pouring, four sub-operations were defined, as shown in Figure 3:
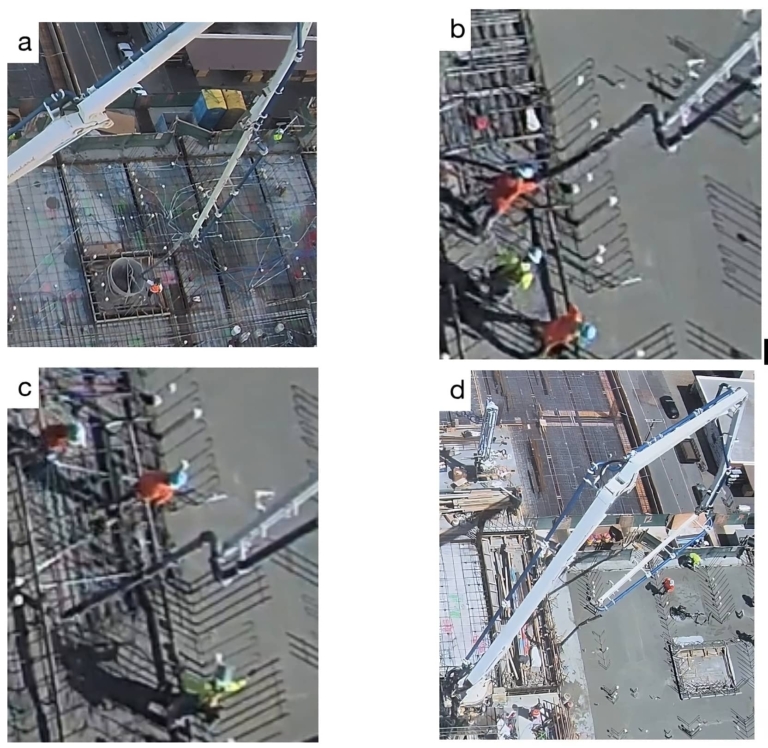
The reason why this operation is made of four sub-operations is that the process typically startswith the arrival of the pouring bucket, followed by the boom movement, may involve intermittent idling periods, and concludes with the boom moving and folding back. These sub-operations capture the key temporal and spatial stages of slab concrete pouring, allowing the computer vision model to recognize each stage and then identify the entire operation.
Approximately 2,000 image frames were extracted and annotated from the 9-month video dataset, specifically focusing on footage from the right zone of the project recorded on May 3, 2024. Annotation was conducted using the Computer Vision Annotation Tool (CVAT), labeling each sub-operation to prepare the data for model training.
The YOLOv8 was fine-tuned using the annotated dataset to detect each of the four sub-operations in real time. The model was trained to recognize key spatial relationships of workers, equipment and materials—such as the position of the boom nozzle relative to workers, buckets, and the slab surface—to classify each sub-operation accurately.
For each sub-operation detected, the model extracted start and end timestamps directly from the video, enabling real-time tracking of the operation. These sub-operation durations were then aggregated to compute the total duration of the slab concrete pouring operation. This process resulted in a real-time as-built schedule for the operation, forming the foundation for creating real-time production system modeling.
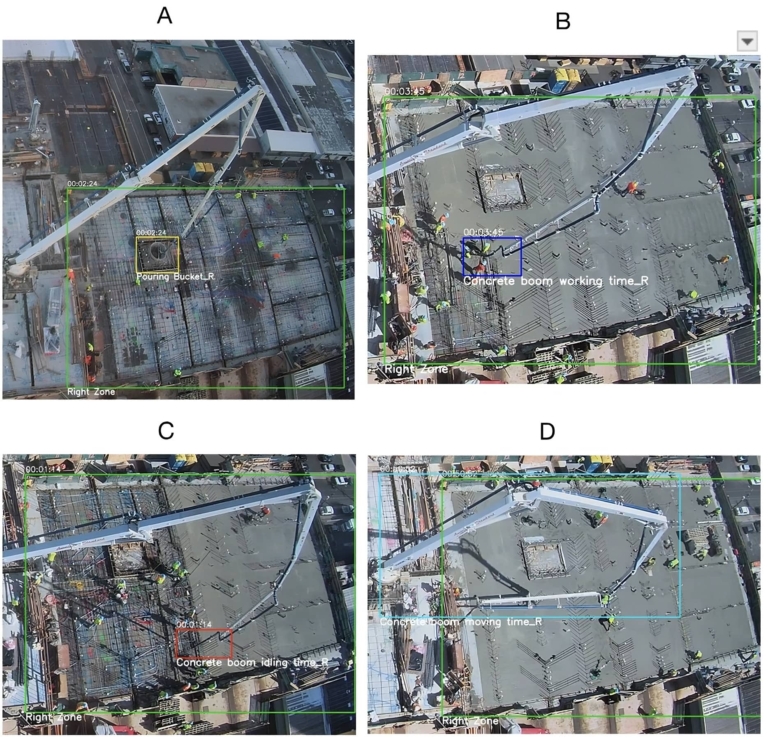
After training the YOLOv8 model on the annotated dataset, it successfully detected all four sub-operations associated with the slab concrete pouring operation: Pouring Bucket, Concrete Boom Working Time, Concrete Boom Idling Time, and Concrete Boom Moving Time. A 3-hour and 55-minute video of the slab concrete pouring process was used as input to the trained model. As shown in Figure 4, the model performed real-time detection directly from the video footage, automatically identifying the start and end times of each sub-operation. These timestamps were then aggregated to compute the overall start and end times of the complete slab concrete pouring operation.
The model generated an Excel sheet containing the start and end times of each detected sub-operation, along with the aggregated start and end times of the overall slab concrete pouring operation. The total video duration was 14,105.42 seconds (approximately 3 hours and 55 minutes). The YOLOv8 model successfully detected 13,987.54 seconds of operation, equivalent to around 3 hours and 53 minutes. The difference between these two durations represents the total lost time, calculated as 117.88 seconds, or approximately 1 minute and 58 seconds. This lost time corresponds to periods when the model was unable to detect any sub-operation from the video frames, representing minor detection errors.
The performance of the trained YOLOv8 model was evaluated using multiple metrics to assess its accuracy in detecting sub-operations involved in the operation of slab concrete pouring. Figure 5 shows the normalized confusion matrix, illustrating strong classification performance across all sub-operation classes and the right zone. The model achieved perfect accuracy (1.00) in identifying the Right Zone, Concrete Boom Moving Time_Right, and Pouring Bucket_Right. Concrete Boom Working Time_Right and Concrete Boom Idling Time_Right were also classified with high accuracy, at 98% and 93%, respectively. Minor misclassifications occurred between visually similar sub-operations. For instance, 7% of Idling Time_Right frames were incorrectly classified as Working Time_Right. These confusions likely stem from subtle transitions between idle and active phases, which may be visually ambiguous. Additionally, a small portion of Working Time_Right frames (6%) was misclassified as background, highlighting occasional challenges in distinguishing activity from visually static frames.
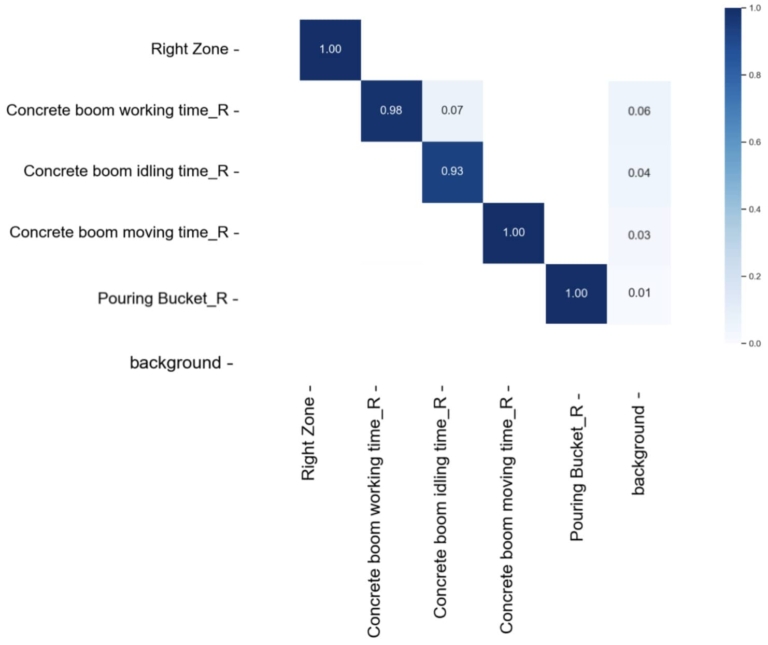
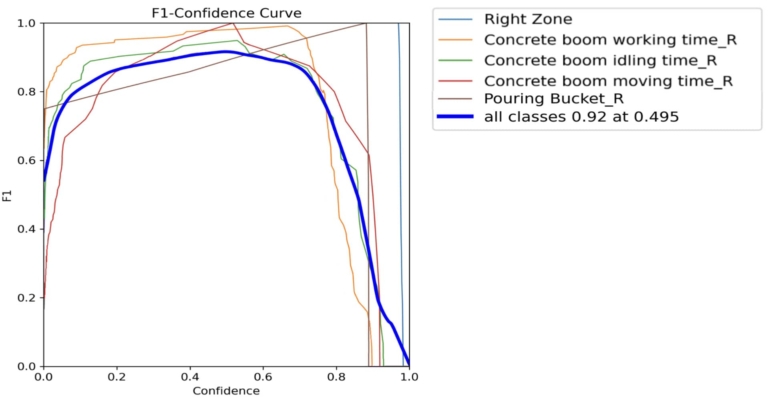
Figure 6 presents the F1-Confidence Curve, illustrating strong model performance across all target classes. The overall F1 score peaks at 0.92 at a confidence threshold of 0.495, indicating an optimal trade-off between precision and recall. Among the classes, Concrete Boom Working Time_Right and Concrete Boom Idling Time_Right consistently achieve high F1 scores across a broad confidence range, reflecting reliable detection. Meanwhile, Pouring Bucket_Right and Concrete Boom Moving Time_Right also show strong but slightly more variable performance. The consistently high F1 scores across classes highlight the model’s robustness in accurately detecting sub-operations within real-time video data.
In Figure 7, the training and validation loss curves for bounding box loss, classification loss, and distribution focal loss (DFL) all showed smooth and steady convergence over 300 epochs, indicating stable model training. Performance metrics such as precision, recall, and mean Average Precision (mAP) continued to improve throughout training. The final values include:
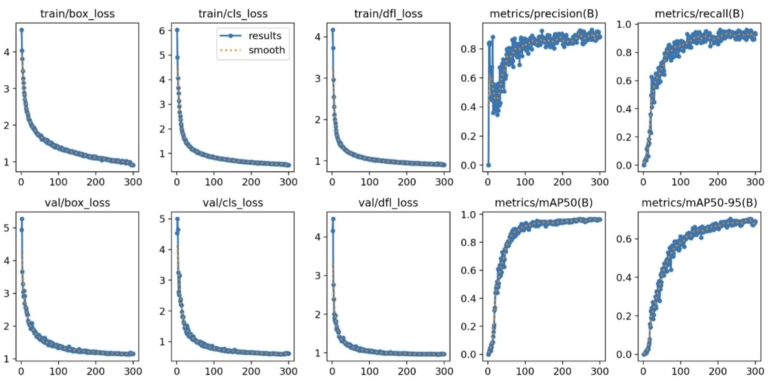
These results collectively demonstrate the YOLOv8 model’s strong capability in detecting detailed construction sub-activities in real time with high accuracy, making it suitable for extracting reliable production data from continuous video streams.
The effectiveness of the trained YOLOv8 model was limited by several factors, including suboptimal camera placement (either too distant to capture detail or too close to cover entire zones), occasional poor video resolution and blurriness that hindered object and crew identification, and insufficient lighting during early morning work. Additional issues included weather-related obstructions, such as raindrops on the lens, which degraded visual clarity during rainy conditions. Furthermore, the model’s performance may be affected by new combinations of worker–equipment configurations and interactions that were not represented in the training dataset, highlighting the model’s sensitivity to unseen operational patterns in dynamic construction environments.
The vision-based model will need to be further trained to extract the rest of production data, including the number and location of laborers and equipment involved in slab concrete pouring across nine months of video footage. It must also be trained to detect other construction operations and extract their production data in real time.
To improve the model’s generalization, future work will focus on enhancing its ability to handle variability both within the 40-story cast-in-place concrete project located in urban Honolulu and across other construction projects. Within this project, the model will be adapted to account for fluctuations in camera distance, weather, lighting conditions, and new combinations of worker–equipment configurations and interactions, ensuring consistent performance across the 9-month video footage. Beyond this site, the model will be extended to multi-camera environments, diverse equipment configurations, and differing operation decompositions, enabling it to detect similar operations and extract production data in real time across a wide range of project settings, camera angles, and construction workflows.
Project Production Institute. (2023). Glossary of key terms. Retrieved from https://projectproduction.org/glossary/operation.
Spearman, M. L., & Hopp, W. J. (2020). The case for a unified science of operations. Production and Operations Management, 30(3), 802–814.
Hogan, P. (2019, August 23). Challenges and Trends in Construction Data Collection. FASA Cares. https://fasacares.org/challenges-and-trends-in-construction-data-collection/.
Engineering News-Record. (2013, March 6). The new guard: RFID and other tracking technology on jobsites. https://www.enr.com/articles/6167-the-new-guard-rfid-and-other-tracking-technology-on-jobsites.
Kim, H., Ahn, C. R., Engelhaupt, D., & Lee, S. (2018a). Application of dynamic time warping to the recognition of mixed equipment activities in cycle time measurement. Automation in Construction, 87, 225-234.
Rashid, K. M., & Louis, J. (2019). Times-series data augmentation and deep learning for construction equipment operation recognition. Advanced Engineering Informatics, 42, 100944.
Bae, J., Kim, K., & Hong, D. (2019). Automatic identification of excavator activities using joystick signals. International Journal of Precision Engineering and Manufacturing, 20, 2101-2107.
Yang, Z., Yuan, Y., Zhang, M., Zhao, X., & Tian, B. (2019). Assessment of construction workers’ labor intensity based on wearable smartphone system. Journal of construction engineering and management, 145(7), 04019039.
Sabillon, C. A., A. Rashidi, B. Samanta, C. F. Cheng, M. A. Davenport, and D. V. Anderson. 2017. “A productivity forecasting system for construction cyclic operations using audio signals and a Bayesian approach.” In Proc., Construction Research Congress 2018, 295–304. Reston, VA:ASCE. https://doi.org/10.1061/9780784481264.029.
Xiao, B., & Zhu, Z. (2018). Two-dimensional visual tracking in construction scenarios: A comparative study. Journal of Computing in Civil Engineering, 32(3), 04018006.
Zhu, Z., Ren, X., & Chen, Z. (2017). Integrated detection and tracking of workforce and equipment from construction jobsite videos. Automation in Construction, 81, 161-171.
Kim, J., Chi, S., & Seo, J. (2018). Interaction analysis for vision-based operation identification of earthmoving excavators and dump trucks. Automation in Construction, 87, 297-308.
Roberts, D., Golparvar-Fard, M., Niebles, J. C., Gwak, J., & Bao, R. (2018). Vision-based construction operation analysis in long video sequences via hidden Markov models: Experiments on earthmoving operations. In Construction Research Congress 2018 (pp. 164-173).
Roberts, D., & Golparvar-Fard, M. (2019). End-to-end vision-based detection, tracking and operation analysis of earthmoving equipment filmed at ground level. Automation in Construction, 105, 102811.
Chen, C., Zhu, Z., & Hammad, A. (2020). Automated excavators operation recognition and productivity analysis from construction site surveillance videos. Automation in construction, 110, 103045.
Chen, C., Xiao, B., Zhang, Y., & Zhu, Z. (2023). Automatic vision-based calculation of excavator earthmoving productivity using zero-shot learning operation recognition. Automation in Construction, 146, 104702.
Luo, X., Li, H., Yu, Y., Zhou, C., & Cao, D. (2020). Combining deep features and operation context to improve recognition of activities of workers in groups. Computer‐Aided Civil and Infrastructure Engineering, 35(9), 965-978.Yaseen, M. (2024). What is YOLOv9: An in-depth exploration of the internal features of the next-generation object detector. arXiv preprint arXiv:2409.07813.