Capital projects often suffer from significant cost overruns and schedule delays. These issues are frequently caused by poor early alignment, fragmented communication, and a lack of understanding of how production flows impact project performance, leading to high-stress environments and jeopardized profits. Therefore, this study showcases how a Hospital project in California can overcome these industry challenges through a pioneering blend of Operations Science (OS) and the Last Planner System® (LPS). By leveraging proven metrics—Work in Process (WIP), Cycle Time (CT), and Throughput (TH)—the team systematically mapped design, permitting, fabrication, and installation into cohesive production flows. This fusion of OS insights with LPS’s collaborative planning identified a potential five-month reduction in the structural steel phase. The result of this study shows how OS reframes design and construction as integrated production systems, enabling real-time data analysis that goes beyond “complete or incomplete.” The team’s visual dashboards and weekly pull sessions improve alignment, drive early decision-making, and continuously adjust for fluctuations in demand, resulting in more predictable outcomes, less stress, and fewer cost overruns. Expected outcomes include bridging the gap by integrating OS metrics into LPS to drive better decision-making, accelerating schedules by applying OS concepts to structural steel, fostering proactive alignment through early cross-functional collaboration and real-time data insights, and providing scalable practices for future projects. The findings aim to advance the field of Project Production Management (PPM) by providing actionable insights and future academic and industry work.
Keywords: Project Production Management; Last Planner System; Operations Science; Production Systems Optimization; Integration.

Guillermo Prado Lujan, current industry practitioner and construction researcher, is currently working as Production Manager at The Boldt Company in the Bay Area, California. Guillermo has worked with public and private organizations in South American and North America in the implementation of Project Production Management, Lean Construction, Indust ...

Felipe Engineer-Manriquez, a best-selling author and keynote speaker, is the Project Delivery Services Director at The Boldt Company and host of The EBFC Show podcast. Renowned for driving change in construction with Lean and Agile practices, he simplifies work processes significantly. As a Registered Scrum Trainer™ and Lean Construction Institute C ...
Capital projects in the engineering and construction (E&C) industry continue to face persistent challenges related to cost overruns, schedule delays, and fragmented coordination. Studies show that capital projects are not getting acceptable results: 31% did not meet cost or schedule, 48% met either cost or schedule, 21% met both cost and schedule, and only 9% met cost, schedule, production alignment. These issues are often rooted in a lack of early alignment, poor communication, unawareness of the consequences of poor inventory management and a limited understanding of how production systems behave under real-world constraints [1]. In response, the industry has increasingly turned to Lean Construction (LC) methods such as the Last Planner System® (LPS) to improve planning reliability and collaboration [2]. More recently, the emergence of Operations Science (OS) (with roots in Operations Research and Operations Management []) and its application through Project Production Management (PPM) has introduced a rigorous, data-driven framework for analyzing and optimizing production systems [3]. While both LPS and OS have demonstrated value independently, there remains a gap in the literature and practice regarding their integrated application in healthcare building construction.
This paper addresses that gap by presenting a case study of a Hospital project in California that combines LPS and PPM to optimize the structural steel design phase. By leveraging OS metrics—Work in Process (WIP), Cycle Time (CT), and Throughput (TH)—and integrating them into LPS workflows, the project team was able to identify and mitigate production bottlenecks, reduce schedule risk, and improve decision-making. The result was a potential five-month reduction in the structural steel phase and a significant decrease in potential overtime costs. The objective of this paper is to demonstrate how the integration of OS and LPS can reframe construction as a production system, enabling real-time analysis, proactive planning, and scalable improvements. This research contributes to the field of PPM by offering a model-based approach that shows the complementary nature between LPS and PPM.
LPS is a collaborative production planning and control methodology developed to improve workflow reliability and project performance in construction. It is built on the principle that those closest to the work, the Last Planners—foremen, superintendents, and other frontline supervisors—are best positioned to plan and manage tasks effectively. LPS operates through a hierarchy of planning levels: master scheduling, phase scheduling, lookahead planning, and weekly work planning. Each level progressively refines the scope and detail of work, ensuring that only tasks that are well-defined, sound, sequenced correctly, and appropriately sized are committed to execution [4], [5]. A key innovation of LPS is its emphasis on reliable promising, where commitments are made only when prerequisites are met, shielding crews from uncertainty and enabling smoother handoffs between trades [5], [6]. The system also incorporates Percent Plan Complete (PPC) as a performance metric, tracking the reliability of weekly work plans and identifying root causes of plan failures to drive continuous improvement [4], [7]. LPS has been widely adopted across the globe and has demonstrated significant benefits (among other methods of the lean construction literature), including reduced variability, improved coordination, and enhanced project outcomes.
OS is defined by the Project Production Institute (PPI) as "the study of the transformation of resources to create and distribute goods and services" [3]. OS focuses on understanding the interaction between demand and production, the variability associated with either or both and describes the set of buffers required to synchronize demand with production. PPM is the application of OS to projects, which applies production management principles to the delivery of capital projects. Central to PPM are production systems, which PPI defines as "a specific or defined set of operations within a larger supply network or value chain that produces technical or physical output to satisfy an external demand" [3].
While LC and LPS have contributed significantly to improving collaboration and planning reliability in construction, recent research suggests that their impact on measurable project performance remains difficult to quantify. A systematic review of over 1,300 IGLC papers found that only 3.8% explicitly addressed performance improvement, with a lack of standardized metrics and limited cross-project benchmarking hindering broader insights [8]. This highlights an opportunity to complement existing lean practices with more robust, system-oriented approaches. PPM, grounded in OS, offers such a framework by modeling projects as production systems and applying principles like flow, capacity, and variability to optimize outcomes [9]. Rather than replacing LC or LPS, PPM can enhance their effectiveness by introducing data-driven tools that support continuous improvement and system-wide performance evaluation.
Moreover, the literature also provides information about the means in which LC methods and tools interact with OS and PPM to enhance project performance. OS and LC form a complementary relationship that enhances production management in construction. While Lean focuses on waste elimination and collaborative practices, OS provides a mathematical foundation for understanding production system behavior through three key buffers: time, inventory, and capacity [10]. OS enables precise analysis of how variability must be buffered, while Lean tools like Value Stream Mapping (VSM) [11] and LPS provide practical implementation mechanisms. Among others, Prado [12] highlighted this synergy in offsite construction, where operations management principles enabled just-in-time (JIT) delivery by synchronizing manufacturing output with site installation capacity. This technical integration balances Lean's cultural emphasis on continuous improvement with scientific production system design. Therefore, this paper aims to demonstrate how the integration of PPM (from the Production System Optimization-PSO- and the Project Production Control-PPC- frameworks, this study will use PSO) and LPS can reframe construction as a network of production systems, enabling real-time analysis, proactive planning, and scalable improvements. This research contributes to the field of PPM by offering a model-based approach that shows the complementary nature between collaborative planning (LPS) and production management analysis (PPM).
This study employs a case study-based research design to explore how integrating PPM with LPS can enhance production planning and control in complex healthcare construction. The Hospital project, specifically the structural steel design (34 sequences – which are the production units for this study) and submittal process serves as the focal case. The methodology is structured into three sequential steps: production system analysis, schedule optimization, and integration with LPS planning levels.
The PSO model was conducted using the standard developed by Strategic Project Solutions (SPS) and PPI. The information was collected by the authors of this paper and the SPS team using virtual calls, interviews, and workshops, as well as different types of documentation coming from the companies involved, such as technical specifications, drawings, and schedules from these parties. For more specific details of the steps to conduct this type of analysis, please see the research projects displayed in the PPI website. The process map of the design phase of the case study is shown in figure 1.
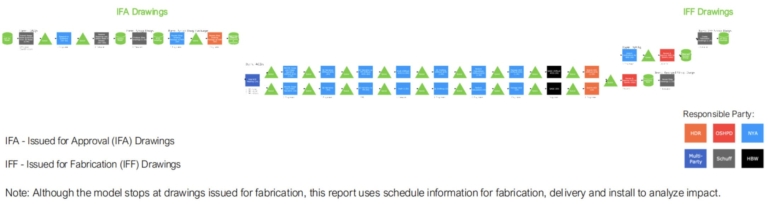
Figure 1 shows the different value streams (3) to have the approval of the design detailed drawings for starting fabrication, based on the OSHPD (or HCAI) standards, and the structural steel fabricator’s internal requirements. This represents the baseline for the analysis. This analysis followed a structured, data-driven approach consisting of the following key activities:
Figure 2 shows a snapshot of 9 out of 34 sequences design, fabrication, shipping and installation processes to understand the whole context in which this holistic production system is operating. The schedule vs simulation colors show a misalignment of the capacity and demand for the design process specifically. These results will represent the current state to solve with the modifications proposed in step 2.
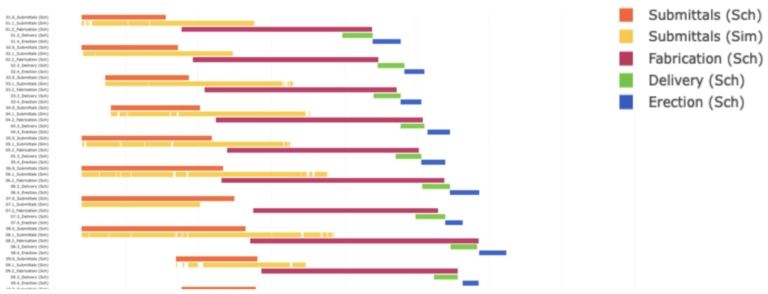
The simulation revealed several critical performance issues:
Following the baseline analysis, the second step involved testing and evaluating optimization strategies to improve the performance of the structural steel submittal production system. This step followed a structured approach using the PSO framework to model and analyze the impact of proposed changes on system behavior and schedule alignment. The baseline model highlighted three primary constraints: limited structural detailing capacity, long OSHPD review cycles (especially for NMAs and ACDs, which are the different review design procedures), and excessive WIP due to simultaneous release of multiple sequences. Based on these constraints, several optimization strategies were proposed:
Figure 3 shows a snapshot of 9 out of 34 sequences regarding their design, fabrication, shipping and installation phases to see the implications in all these phases (holistic view) of implementing the optimization strategies in the structural steel phase of the project.
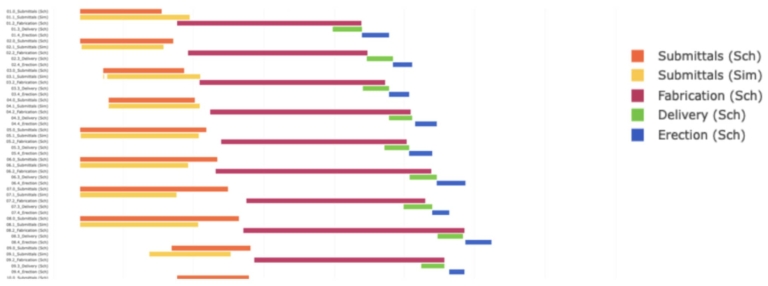
With these strategies being implemented, the demand and capacity bars (yellow and orange lines in figure 3) are now matching, which represents a more realistic workplan (or production schedule). Additionally, these strategies allow the following opportunities:
These results are summarized in table 1, which compares the two sets of results.
| Metric | Before Optimization | After Optimization |
|---|---|---|
| Percent of sequences completed on time | 3% (1 of 34 sequences) | 68% (23 of 34 sequences) |
| Average delay per sequence (days) | 127 days | N/A (significantly reduced) |
| Time to produce shop drawings (days) | 81 days | 33 days |
| Percent of sequences starting fabrication on time | 44% (15 of 34 sequences) | 85% (29 of 34 sequences) |
| Average fabrication start delay (days) | 112 days | 11 days |
The integration of OS metrics and PSO-derived insights into LPS offers a powerful opportunity to enhance planning reliability, improve constraint management, and support proactive decision-making across all levels of project planning. By adjusting the demand (schedule and sequences for design) into a more realistic-to-capacity schedule, the workplan and its TH will be more aligned to the demand of this scope of work, resulting in a more reliable basis for going into more detail in the 5 levels of planning of the LPS. Table 2 shows this potential alignment.
| LPS Planning Level | Purpose | Integration (PSO Metrics) | Benefits | Opportunities (Optimization) |
|---|---|---|---|---|
| Master Scheduling | Define project milestones and overall execution strategy. | Use throughput capacity (e.g., 275–510 IFA drawings/week) and variability data to validate milestone feasibility. | More realistic and achievable milestones; reduced risk of cascading delays. | Align milestones with increased capacity and reduced delays (e.g., 5-month recovery). |
| Phase Scheduling | Break down master schedule into detailed, phase-specific plans. | Apply modeled handoffs, resource constraints, and WIP thresholds to define sequence logic and buffer strategies. | Improved coordination and stable production flow within each phase. | Implement staggered release strategies and WIP control to match optimized flow. |
| Lookahead Planning | Identify and remove constraints to make work ready. | Screen tasks using readiness criteria, WIP levels, and cycle time variability (e.g., 33 vs. 81 days). | Increased plan reliability and reduced rework due to better constraint management. | Prioritize high-throughput sequences and reduce system overload. |
| Weekly Work Planning | Commit to executable tasks based on actual conditions. | Select tasks based on WIP levels, real-time throughput and backlog readiness; track PPC alongside cycle time. | Higher PPC and more predictable weekly performance. | Use improved cycle times (33 days) to commit to more reliable weekly plans. |
| Daily Coordination | Adjust plans in real time based on field conditions. | Use short-interval control metrics (e.g., daily throughput, crew utilization) to adjust work plans. | Greater agility in responding to disruptions and maintaining continuous workflow. | Monitor actual vs. expected production rates to support proactive adjustments. |
The integration of Operations Science (OS) metrics into the Last Planner System® (LPS) in this study builds upon and extends previous research in both domains. While LPS has long been recognized for improving planning reliability and collaboration [4], [5], its impact on measurable productivity performance outcomes has remained difficult to quantify [8]. This study addresses that gap by applying a PSO model to a real-world healthcare project and demonstrating how production metrics—such as throughput (275–510 IFA drawings/week), cycle time (reduced from 81 to 33 days), and WIP thresholds—can be embedded into each level of LPS planning. These findings align with the theoretical propositions of Spearman [10] and Prado [12], who emphasized the complementary nature of Lean and OS. However, this study goes further by operationalizing that integration through a structured model and showing how it can directly inform milestone setting, constraint screening, and weekly work planning. The resulting potential improvements in plan reliability and schedule alignment (e.g., 5-month recovery, 85% on-time fabrication starts) provide empirical support for the value of combining collaborative planning with scientific production control.
Despite these promising results, several limitations must be acknowledged. First, the research is based on a single case study within a specific scope of work—structural steel design—limiting the generalizability of the findings. The analysis focuses solely on the design phase of this scope, without extending into fabrication or installation, which may behave differently under production constraints. Additionally, the project is a healthcare facility, a sector known for its complexity and regulatory oversight, which may not reflect conditions in other building types. Furthermore, the study relies exclusively on the PSO model, one of several tools available within the broader PPM toolkit. Other models, such as Supply Chain Optimization (SCO), PPC or Computer Aided Production Engineering (CAPE) [1], could offer additional insights. Future research should explore multi-scope, multi-phase applications and compare different OS and PPM tools (even LC tools and methods such as takt planning) to develop a more comprehensive framework for integrating PPM and LPS in diverse project environments.
This study sets out to explore whether integrating PPM with the LPS could enhance production planning and control in complex construction projects. Through a case study of the Hospital’s structural steel design phase, the research demonstrated that the application of the PSO model successfully identified key bottlenecks and inefficiencies, and that the integration of OS metrics into LPS planning levels offers a structured pathway to improve planning reliability and system performance. The results—such as a projected 5-month schedule recovery, a 60% reduction in shop drawing cycle time, and an 85% on-time fabrication start rate—highlight the potential of this integrated approach to deliver substantial benefits.
While these findings align with the study’s objectives and contribute to the growing body of PPM literature, they remain to be implemented in the actual project. As such, the results represent a validated opportunity rather than a realized outcome. Future research should focus on the implementation phase of these strategies, expanding the scope beyond design to include fabrication and installation, and exploring additional OS tools such as supply flow optimization. Once implemented, the lessons learned and performance data from this project will serve as a valuable foundation for further research and refinement of integrated OS-LPS methodologies in capital project delivery.
[1] Zabelle, T. (2024). Built to Fail. Forbes Books. South Carolina.
[2] Ballard, G. & Tommelein, I. (2021). 2020 Current Process Benchmark for the Last Planner® System of Project Planning and Control.” Project Production Systems Laboratory, UC Berkeley, CA.
[3] Project Production Institute. (2023). Glossary. https://projectproduction.org/resources/glossary/
[4] G. A. Howell, Pull Planning Guide for Foremen and Supervisors, Lean Construction Institute, 2005.
[5] G. Ballard and G. A. Howell, “An Update on Last Planner,” Lean Construction Institute, 2003.
[6] Lean Construction Institute, “Last Planner System®,” [Online]. Available: https://leanconstruction.org/lean-topics/last-planner-system/
[7] Project Production Systems Laboratory (P2SL), “Glossary: Last Planner System,” [Online]. Available: https://p2sl.berkeley.edu/glossary/knowledge-center-glossaryatoz/
[8] A. S. Asmone, A. Pal, D. Murguia, A. Rathnayake, and C. Middleton, “Where is the evidence of performance improvement in the lean construction literature?,” in Proc. 33rd Annual Conf. Int. Group for Lean Construction (IGLC), Osaka and Kyoto, Japan, 2025, pp. 1–12. [Online]. Available: https://doi.org/10.24928/2025/0128
[9] Project Production Institute, “A Comparison of Lean Construction with Project Production Management,” PPI Position Paper, 2017. [Online].
[10] Spearman, M. (2023). Lean Demystified: Operations Science Explains and Expands Lean. PPI 2023 Technical Conference.
[11] Zabelle, T. (2018). Operations Science View of Value Stream Mapping. Journal of Project Production Management. 2.
[12] Prado, G. (2022). Operations Management Concepts Applied to Offsite Construction. Proceedings of 2022 Modular and Offsite Construction (MOC) Summit, Edmonton, Canada, 225-232.
[13] Project Production Institute. (2020). Five Levers Of Production System Optimization. PPI Technical Guide 01.