The adoption of offsite construction methods presents a forward-thinking solution to critical challenges such as stagnant productivity rates, widespread housing shortages, skilled labor shortages, and increasing carbon emissions. However, moving the production location from onsite to offsite makes management a more complex task, resulting in offsite construction projects not achieving the time and cost targets. For instance, we observed that an offsite production factory incurred unnecessary high inventory costs due to holding too many products in stock before the onsite installation started. This research paper delves into the implementation of the Production System Optimization (PSO) framework to manage capacity, inventory and variability of offsite construction projects. The Production Optimizer, a digital production analysis, simulation, and optimization tool, offers valuable insights into analyzing production processes, including queuing times and bottlenecks, while also projecting inventory investment by accounting for variabilities in onsite installation demand and offsite production processes. A critical examination of offsite production variability is essential to prevent excessive inventory, thus conserving vital resources like labor, capital, and stocking space. Our findings suggest that factory managers can achieve more optimal inventory investment by measuring and controlling variabilities in the production process and onsite demand. This paper underscores the significance of applying Operations Science (OS) principles and PSO framework in the planning stages of offsite modular projects, contributing to a strategic blueprint for improving efficiency and sustainability in the AEC industry.
Keywords: Offsite construction; Operations Science; Production System Optimization; Inventory Management.

Bochen is a Ph.D. student in Stanford University major in Sustainable Design and Construction program under Civil and Environmental Engineering department. His research interests are applying operations science principles and process simulation methods for supply chain management of prefabrication/modular constructions. Bochen had industry experience ...

Martin Fischer is a Professor of Civil and Environmental Engineering and (by Courtesy) Computer Science at Stanford University. He is also the Director of the Center for Integrated Facility Engineering, a Senior Fellow of the Precourt Institute for Energy, and the Coordinator of the Building Energy Efficiency Research at the Precourt Energy Efficienc ...
The transition to fabricate building components in an offsite factory setting is increasingly viewed as a strategic response to stagnant productivity, housing shortages, skilled labor deficits, and escalating carbon emissions [1][2][3]. Shifting construction activities from traditional project sites to offsite factories with advanced manufacturing-like production can enable the construction industry to make a step change in providing high-performance buildings with lower costs [4]. However, extending the workflow from onsite to offsite makes management a more complex task. For instance, variabilities in onsite demands and offsite production are hard to predict complicating synchronization between offsite production and onsite installation. Construction projects implementing offsite fabricated building components have already reported difficulties in synchronizing the flow of material, information and capital in the offsite-onsite supply chain [5]. Consequently, ineffective management of offsite construction projects can lead to significant risks such as overproduction, large inventory, and long lead times [6][7].
Lack of understanding variabilities in offsite production and onsite demand can cause excessive inventory produced in real world projects. To illustrate this situation, a case study is presented in this research paper. The traditional mindset of productivity- and schedule- based production planning methods encourage offsite factory managers to focus on individual productivity and produce for more inventories in order to hedge against variabilities and to ensure products are delivered on time, despite the resulting high inventory levels and cost. However, this push production strategy resulted in excessive inventory buffers and long holding times. As a result, the factory's profit was squeezed by holding these inventories.
Mitigating the excessive inventory problem in the manufacturing-like offsite construction projects requires an entirely new approach. Firstly, the factory managers should consider offsite production, inventory and onsite demand from an integrated perspective. This means shifting from a push production strategy to a pull production strategy and accounts for variability. Tommelein [10] illustrated how variability and the use of pull production reduces inventories and project timeline by simulating the offsite fabrication and onsite installation processes in several scenarios. The authors highlighted the need for reliable production data collected from the sites, which is critical for the quality of the results.
Secondly, detailed knowledge of production operations, variabilities and buffer strategies are needed to help synchronize offsite production with the onsite installation. PSO could be a useful framework to guide this process, leveraging product design, process design, capacity, inventory, and variability. OS principles are the fundamentals of PSO and have been widely used in the manufacturing industry to study the interaction between demand and production and the variability associated with both [11]. More recently, Zabelle [9] described using PSO framework to deliver capital projects, which allows for the application of OS as the theoretical basis to map, model, analyze, optimize, control, and improve project production system performance. Previous works have thus laid the foundation for a new method to align offsite production with onsite progress and corresponding inventory, considering the variabilities in the processes.
This research utilizes PSO to support offsite production planning and selection of inventory levels to balance offsite production according to the variabilities in onsite demand. The proposed approach will gather information and data to map a production process and then use PSO to analyze and identify opportunities to optimize and improve offsite production process and associated inventory plan. Producing modular bathroom pods for a university residential building bathroom pod project is selected as the case study to investigate whether the OS analytical model and the PSO framework can be applied to offsite construction projects. This case study will validate whether the prototyped method can aid the offsite production planning process and support informing sufficient inventory to fulfill the onsite demand.
Since the offsite construction method sits in the intersection of manufacturing and construction, offsite production managers can adopt a manufacturing operations perspective. The term operations refer to the application of resources (e.g., materials, labors, capital, etc.) to the production of goods and services [13]. The field of OS studies the interaction between demand and production and the variability associated with either or both in a supply chain, identifying bottlenecks, impact of variability and opportunities for improvement. OS has been beneficial for the manufacturing industry to form highly efficient production processes and manage inventory [8][17][18].
OS principles use mathematical tools and models from operations research to enable managers to make more efficient planning decisions. Specifically, applying the OS principles assists managers to analyze production variability and better determine the necessary inventory. Prado [12] used an OS analytical model to study the processes of installing cladding walls in a construction project. The result showed that OS metrics can be used to inform construction project management decisions on construction sites. Im et al. [6] utilized Monte Carlo simulation to simulate the variability in onsite demand and implemented a reordering point inventory policy to minimize raw material inventory costs. However, both studies suggested that more research should focus on validating assumptions, such as standard variability values, in more construction projects. This is, in part, because some people in the industry understand variability as a concept, but don’t know how to measure it and quantify it.
PSO provides an OS-based framework of mapping, modeling, analyzing, and simulating a production system to achieve best desired performance to fulfill a demand. According to the Project Production Institute, key areas of focus for PSO are throughput, cycle time, use of resources (capacity and inventory) along with sources and implications of variability [11]. Recently, Bryan et al. [15] applied PSO in civil infrastructure projects to identify and mitigate production-based risks and opportunities that are hidden through the lens of traditional project management. The authors demonstrated PSO can help the project team reduce 20% schedule and improve cycle times up to 300% [15]. Although PSO showed great potential in capital projects, only a few studies discussed applying PSO to model and manage offsite construction projects. Therefore, this research project uses a case study research method to demonstrate to what extent that OS and PSO framework can be an effective management method for the offsite manufacturers to plan efficient production processes and maintain optimal inventory levels.
This research employed a case study approach to explore the implementation of OS principles and the PSO framework in analyzing and modeling the offsite production process of a leading modular bathroom pod company. Production data collection was primarily conducted through interviews with the factory production managers and construction document analysis, including master planning, production schedule, progress tracking, and drawings. The onsite delivery planning schedule was utilized to understand average onsite demand and corresponding demand variability. Production Optimizer, a proprietary software designed specifically for construction production management, supported OS-based analytical modeling of the current production processes. We mapped the current production process to match the offsite production supply with the onsite demand.
The first task was to utilize the production data and analytical model to create a close-to-reality schedule. Leveraging OS principles, Production Optimizer’s analytical model calculated the workflow capacity as well as the average cycle time of producing one batch of bathroom pods. The variability of the production process was considered by using a squared coefficient of variance (SCV) for each production task. By implementing OS principles such as Little’s Law and the VUT equation [13], we were able to estimate a more accurate total duration of producing bathroom pods than the traditional construction scheduling.
The second task was identifying opportunities for improving the current production process design. We performed a capacity utilization analysis to identify bottlenecks and their impacts on production. Capacity utilization is defined as the percentage of a resource’s capacity that is used in production. This value is calculated by dividing the work hours results from analytical modeling by the total production hours for a period. The production resource with the highest capacity utilization rate is considered to be the bottleneck. Thus, by calculating the capacity utilization rate for all resources, we identified a key opportunity to improve the efficiency of the production process.
The third task was to define the optimal inventory level to carry for hedging the variability in the production process, using the Variance of Replenishment-Time Demand equation [14]. Optimizing inventory levels involves considering the variance in production rates and onsite demand frequency. We used the Production Optimizer to conduct an inventory analysis that produced an inventory tradeoff chart. Using this chart, the factory managers were able to decide on an optimal amount of inventory to fulfill the onsite demand. We interpreted and validated the analytical results with the production team and then made management recommendations.
This study explores implementation of OS equations describing the basic behavior of production processes and designing inventory buffer strategy against variability:


The case study was based on a 10-story multipurpose building construction project on the main campus of a university. The building was designed to include a residence hall that will accommodate more than 600 students, office spaces, and an underground parking lot. The focus of the case study was the installation of modular bathroom pods for each housing unit. These bathroom pods are designed and constructed in a factory-controlled environment and then installed directly into the building. The master schedule for installing the bathroom pods is shared with the factory to synchronize the delivery milestones for onsite demand. Since the project is located in the center of the campus, there is no laydown area for the modular bathroom pods. Consequently, the onsite project team required that the bathroom pods be installed immediately upon delivery to the project site.
The modular bathroom pods manufacturer started their business 20 years ago and has been one of the leading companies in the field. The modular bathroom manufacturer, located within an hour's drive from the project site, produced the bathroom pods using a production assembly line. As illustrated in Figure 1, the production process began with fabricating the structural elements of walls, ceilings, and floors. These subassemblies then converged at the box build station to form the volumetric pod. Following the box build station, the mechanical, plumbing, and electrical components were installed, and the pods were finished with fixtures and fittings. Once fabrication was complete, the pods were wrapped and transported to the factory’s stockyard, where they await shipping.

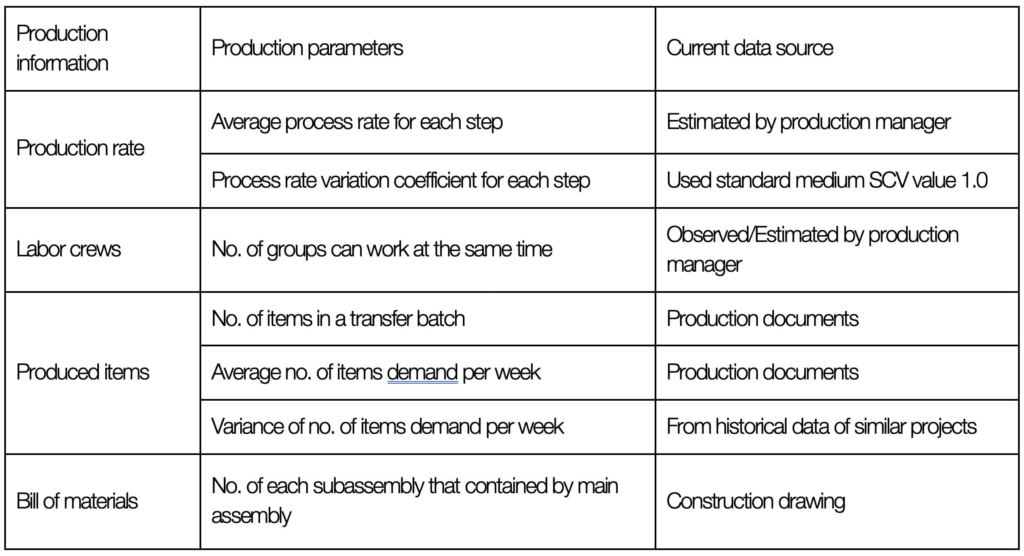
Currently, production management relies on the construction schedule and the critical path method. The average task duration at each workstation is estimated by the production manager and through an analysis of the production schedule. Since variability in production rates is not systematically calculated and analyzed under the current management, the variance of each task duration had to be assumed based on observations, which led to use a medium variability level (Standard Coefficient of Variation of 1.0 was used). The potential variance in onsite demand frequency is determined using historical data from a similar project. Additionally, bathroom construction drawings were used to establish the bill of materials for the main assembly. This approach reflects real-world production conditions, providing a robust foundation for optimizing the supply chain and production processes.
Table 1. Production information and data source summary
The modular bathroom factory has limited stocking space, necessitating careful management of inventory levels to avoid exceeding maximum storage capacity. If the inventory level is too high, the factory incurs additional costs for renting extra storage spaces, arranging transportation and the associated double handling. Since the factory typically operates under lump sum agreements with general contractors, these extra costs can significantly reduce profits. To meet onsite demand and account for uncertainties and disruptions in the supply chain, the factory opts to produce and stock all pods before delivery. This strategy, while mitigating potential supply chain issues, occupies substantial inventory space for each project. Consequently, the factory often must turn away customers when inventory levels are too high. This case study prototyped an OS-based management method to assist the factory manager in analyzing the production process and informing an appropriate inventory level. The case study was completed within two months and the results are presented in the next section.
The factory's baseline schedule determined that pods can be produced in 40 days roughly. The modeling analysis of the production system determined that 68 days would be needed, not 40 days – a 44% difference. When compared to the actual time it took to produce the pods, 70 days, the prediction made through the analytical model was very accurate – only 4% difference with the actual time. This discrepancy arises because construction schedule-based holistic methods failed to address the dynamic interactions between detailed tasks, such as the queuing time caused by variability in processing and arrival times. According to a factory production manager, the factory baseline was determined by summing the effective processing time for all pods in the order, leading to an overly optimistic schedule that complicates offsite construction supply chain synchronization.
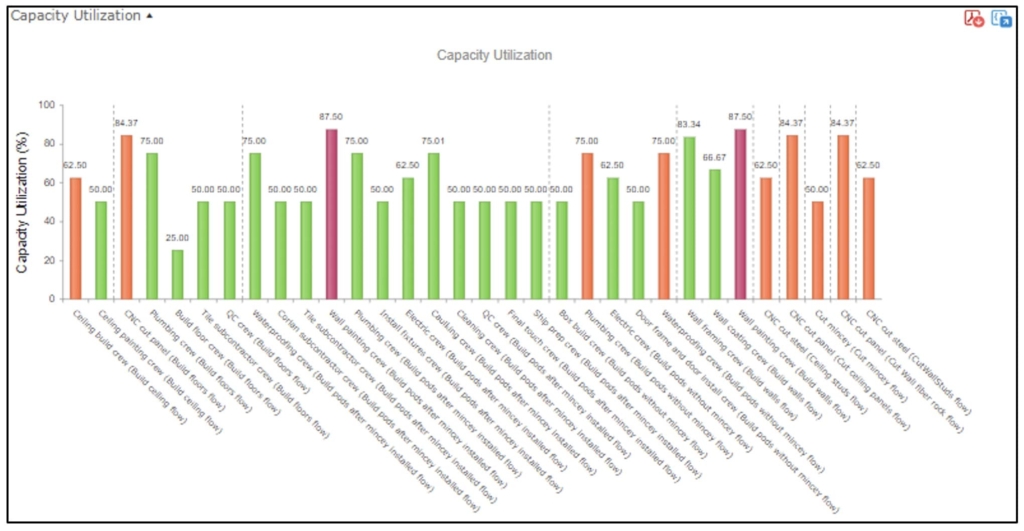
A summary of all the workstation utilization is provided in Figure 2. The analysis shows wall painting crew, CNC machine, and wall framing crew are highly utilized resources. The factory validated these crews are having the most overtime. Opportunities for improvement include improving painting process and adding capacity through purchasing better CNC equipment and automation. An immediate solution is to reassign labor resources from lower utilized workstations to the workstations with higher utilization. The factory is starting a cross-training program to allow for more flexibility in capacity. The production team is also looking for a new paint to reduce the drying time to improve the current process.
The analytical modeling provides the tradeoff between total inventory investment and onsite demand fill rate for the case study. The chart in Figure 3 showed that the investment for inventory increases asymptotically as the requirement for the chance to fulfill onsite demand approaches 100%. Achieving near-perfect fill rates requires significantly higher inventory investments to cover extreme scenarios, presenting a tradeoff between inventory investment and fill rate. Figure 3 shows that the inventory investment of the project can be significantly reduced by 47% if the fill rate of the onsite demand can be reduced to 90% by excluding extreme onsite demand scenarios.
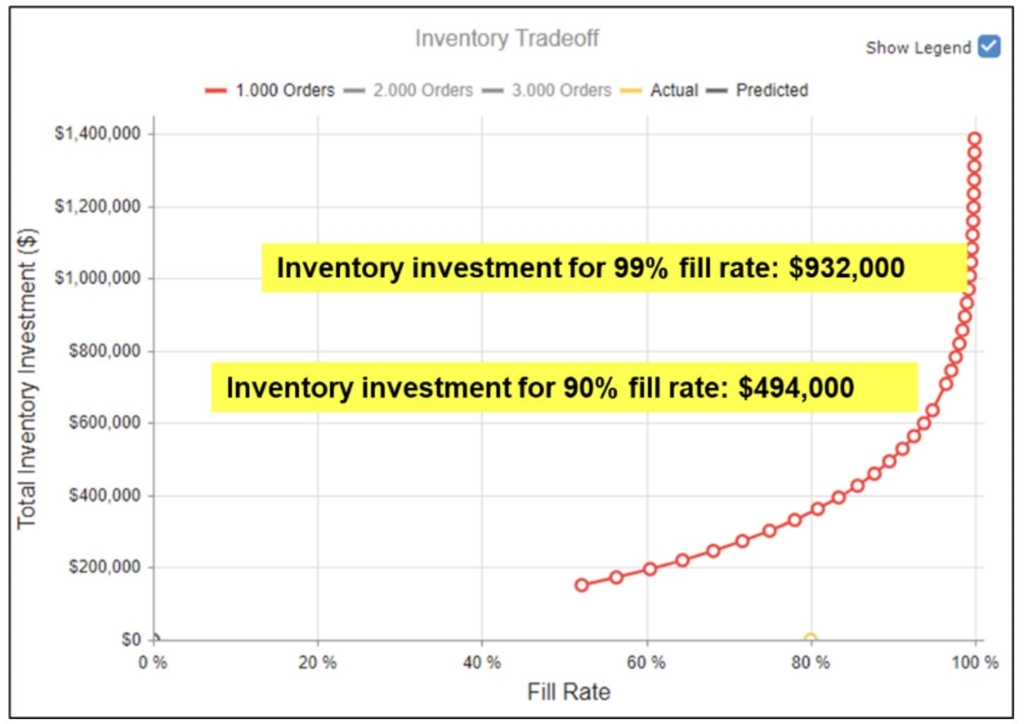
Note: The total inventory investment numbers are dummy numbers to protect data privacy
Furthermore, in a hypothetical scenario (Figure 4) discussed with the onsite project management team, where onsite demand variability can be reduced to 50% through implementing effective production control in the onsite installation plan, the required inventory investment can be significantly reduced by 24% while maintaining the same fill rate. This highlights the potential for substantial operational cost savings by managing and reducing variability in the onsite demand of offsite construction projects. According to the project manager, holding inventories in the factory’s backyard for long can result in high inventory management costs, including stocking space rental fees, handling and security costs, inventory capital opportunity costs, and rework costs for damages by the weather. In the case study, the inventory management cost of holding $932, 000 is estimated to be up to 8% of the total contract value. These inventory holding costs are typically not budged in the project estimate and can directly squeeze the project profit.
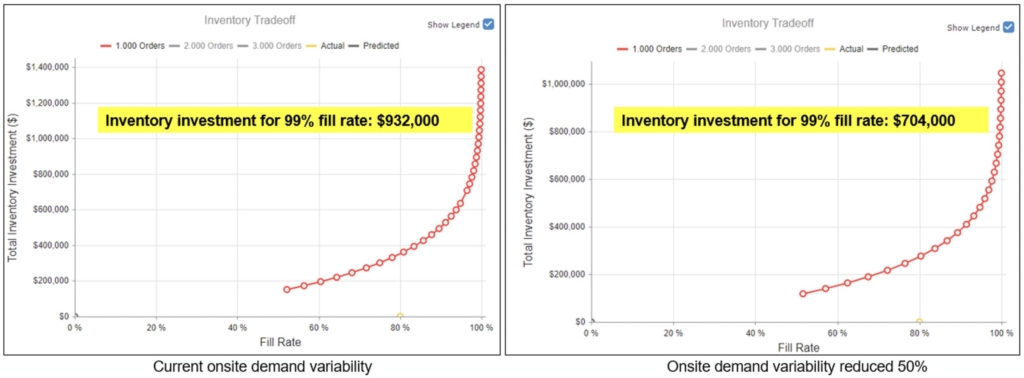
Note: The total inventory investment numbers are dummy numbers to protect data privacy.
This paper prototyped a management method using OS analytical modeling and the PSO framework to enhance an offsite construction project by improving production processes and informing appropriate inventory investment tradeoffs. The production schedule analysis showed that OS-based analytical modeling can predict a more accurate project production timeline by considering the dynamics between operations. The estimated production timeline difference was reduced to 4% compared to 44% difference with the current estimating method. The inventory analysis result showed that the inventory investment can be reduced by 47% if the acceptable fill rate is reduced to 90%. Furthermore, the inventory investment can be reduced by 24% if the onsite demand variability could be reduced by 50% through applying production management methods for site works. High inventory management costs, including storage fees, handling, security, capital opportunity, and weather damage rework, significantly impact project profitability. In the case study, the inventory management cost for holding $932,000 in stock represented up to 8% of the total contract value. Thus, controlling demand variability to maintain appropriate inventory in stock can directly enhance project profitability.
However, there are limitations to the proposed production management method. One challenge is collecting accurate data to determine variability in the production process and onsite demand. The current study assumes medium variability in offsite production and high variability in onsite demand, using standard values in the analytical model. Additionally, the model assumes a steady production process, whereas offsite construction production typically involves a ramp-up period during which laborers are learning on the job. Future research should evaluate the impact of this learning period on production performance. Finally, more case studies are needed to generalize the project production management method and validate its effectiveness across different types of offsite construction supply chains, such as panelized systems.
By addressing these limitations and conducting further studies, the proposed production management method can be refined and expanded to provide robust support for various offsite construction projects, ultimately contributing to greater efficiency and sustainability in the Architecture, Engineering, and Construction (AEC) industry.
[1] Romain de Laubier, A. Burfeind, S. Arnold, Sven Witthöft, and M. Wunder, “The Offsite Revolution in Construction,” BCG Global, May 08, 2019. https://www.bcg.com/publications/2019/offsite-revolution-construction (accessed May 13, 2024).
[2] Wajiha Mohsin Shahzad, Gowthamraj Rajakannu, and Nazanin Kordestani Ghalenoei, “Potential of Modular Offsite Construction for Emergency Situations: A New Zealand Study,” Buildings, vol. 12, no. 11, pp. 1970–1970, Nov. 2022, doi: https://doi.org/10.3390/buildings12111970.
[3] Patrícia Fernandes Rocha, Nuno Oliveira Ferreira, F. Pimenta, and Nelson Bento Pereira, “Impacts of Prefabrication in the Building Construction Industry,” Encyclopedia, vol. 3, no. 1, pp. 28–45, Dec. 2022, doi: https://doi.org/10.3390/encyclopedia3010003.
[4] F. Barbosa et al., “Reinventing construction through a productivity revolution,” McKinsey & Company, Feb. 27, 2017. https://www.mckinsey.com/capabilities/operations/our-insights/reinventing-construction-through-a-productivity-revolution (accessed May 13, 2024).
[5] C. Gravina, K. Wijayaratna, and L. Koskela, “Why Is Flow Not Flowing in the Construction Industry?,” Iglc.net, pp. 283–294, 2022, Accessed: May 13, 2024. [Online]. Available: https://iglc.net/papers/Details/1964
[6] S. ImK.S, Han, Bonsang KooB. Koo, and Y. JungD.Y, “Formulation of a pull production system for optimal inventory control of temporary rebar assembly plants,” Canadian journal of civil engineering, vol. 36, no. 9, pp. 1444–1458, Sep. 2009, doi: https://doi.org/10.1139/l09-072.
[7] W. Zhang, M. W. Lee, L. Jaillon, and C.-S. Poon, “The hindrance to using prefabrication in Hong Kong’s building industry,” Journal of Cleaner Production, vol. 204, pp. 70–81, Dec. 2018, doi: https://doi.org/10.1016/j.jclepro.2018.08.190.
[8] L. Luo et al., “Supply Chain Management for Prefabricated Building Projects in Hong Kong,” Journal of Management in Engineering, vol. 36, no. 2, p. 05020001, Mar. 2020, doi: https://doi.org/10.1061/(asce)me.1943-5479.0000739.
[9]T. Zabelle, Built to Fail: Why Construction Projects Take So Long, Cost Too Much, and How to Fix It. Forbesbooks, 2024.
[10] I. D. Tommelein, “Pull-Driven Scheduling for Pipe-Spool Installation: Simulation of Lean Construction Technique,” Journal of construction engineering and management, vol. 124, no. 4, pp. 279–288, Jul. 1998, doi: https://doi.org/10.1061/(asce)0733-9364(1998)124:4(279).
[11] “Glossary - Project Production Institute,” Project Production Institute,
[12] G. A. Prado Lujan and University of California, Berkeley, “Impact of Production Systems Design on Project Performance: An Operations Science Analysis on a Case Study in Construction,” Digital Collections, 2022. https://digicoll.lib.berkeley.edu/record/275601?v=pdf (accessed May 13, 2024).
[13] W. J. Hopp and M. L. Spearman, Factory Physics. Milano: Mcgraw Hill, 2008.
[14] E. S. Pound, J. H. Bell, and M. L. Spearman, Factory physics for managers : how leaders improve performance in a post-lean six sigma world. New York: Mcgraw-Hill Education, 2014.
[15] G. Bryan, C. Carlson, S. Gaponenko, and S. Mitra, “The Benefits of Modeling and Optimizing Production Systems: An Application on Civil Infrastructure Projects,” CURT, Oct. 30, 2023. https://www.curt.org/2023/10/30/the-benefits-of-modeling-and-optimizing-production-systems-an-application-on-civil-infrastructure-projects/ (accessed May 13, 2024).
[16] S. Abbasi, K. Taghizade, and E. Noorzai, “BIM-Based Combination of Takt Time and Discrete Event Simulation for Implementing Just in Time in Construction Scheduling under Constraints,” Journal of Construction Engineering and Management, vol. 146, no. 12, p. 04020143, Dec. 2020, doi: https://doi.org/10.1061/(asce)co.1943-7862.0001940.
[17] Panos Kouvelis, C. Chambers, and H. Wang, “Supply Chain Management Research and Production and Operations Management: Review, Trends, and Opportunities,” Production and operations management, vol. 15, no. 3, pp. 449–469, Sep. 2006, doi: https://doi.org/10.1111/j.1937-5956.2006.tb00257.x. [18] Shigeo Shingo and N. Bodek, A Study of the Toyota Production System From an Industrial Engineering Viewpoint. Informa, 2019. doi: https://doi.org/10.4324/9781315136509.
[18] Shigeo Shingo and N. Bodek, A Study of the Toyota Production System From an Industrial Engineering Viewpoint. Informa, 2019. doi: https://doi.org/10.4324/9781315136509.